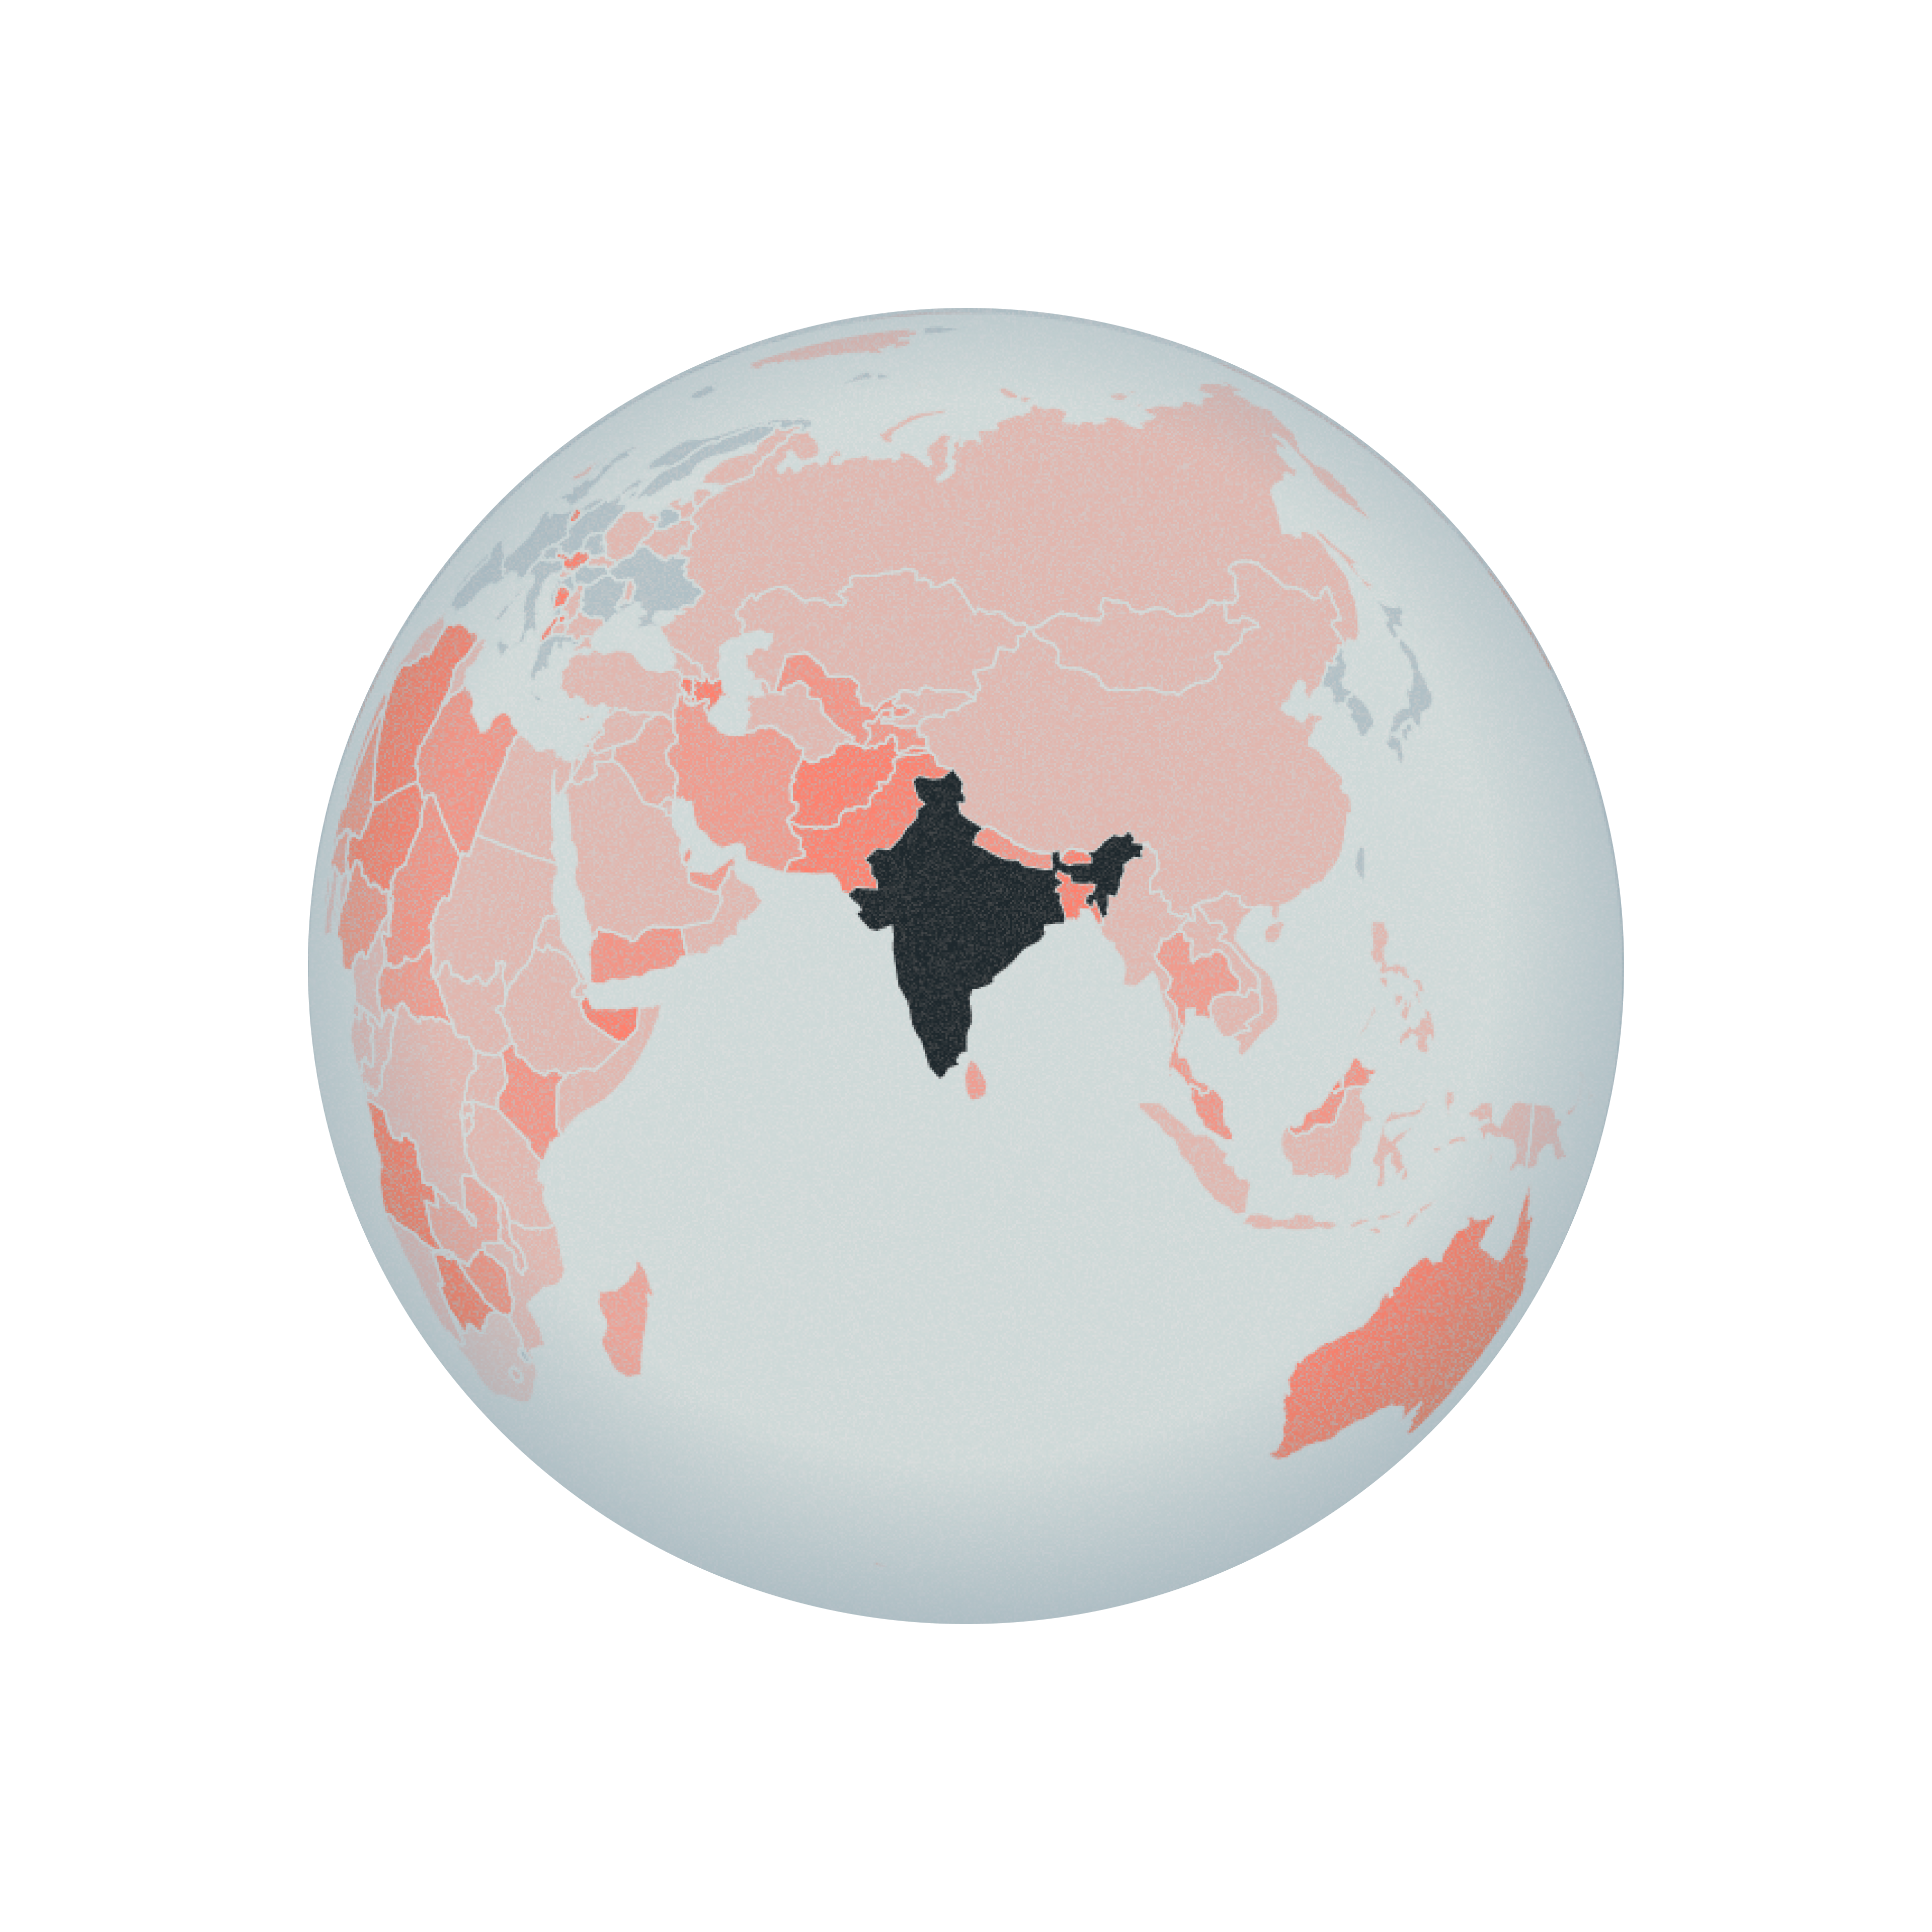
The Child Marriage Data Portal
Every 3 seconds, a girl gets married. Will it still be true in 2030?
The Child Marriage Data Portal is UNICEF's global data portal on child marriage. I designed the web interface and the data visualizations that take regional and country data from ten years ago to today and on to 2030, so anyone can see what happens if the world keeps its current pace or doubles it.
Visit the live site ↗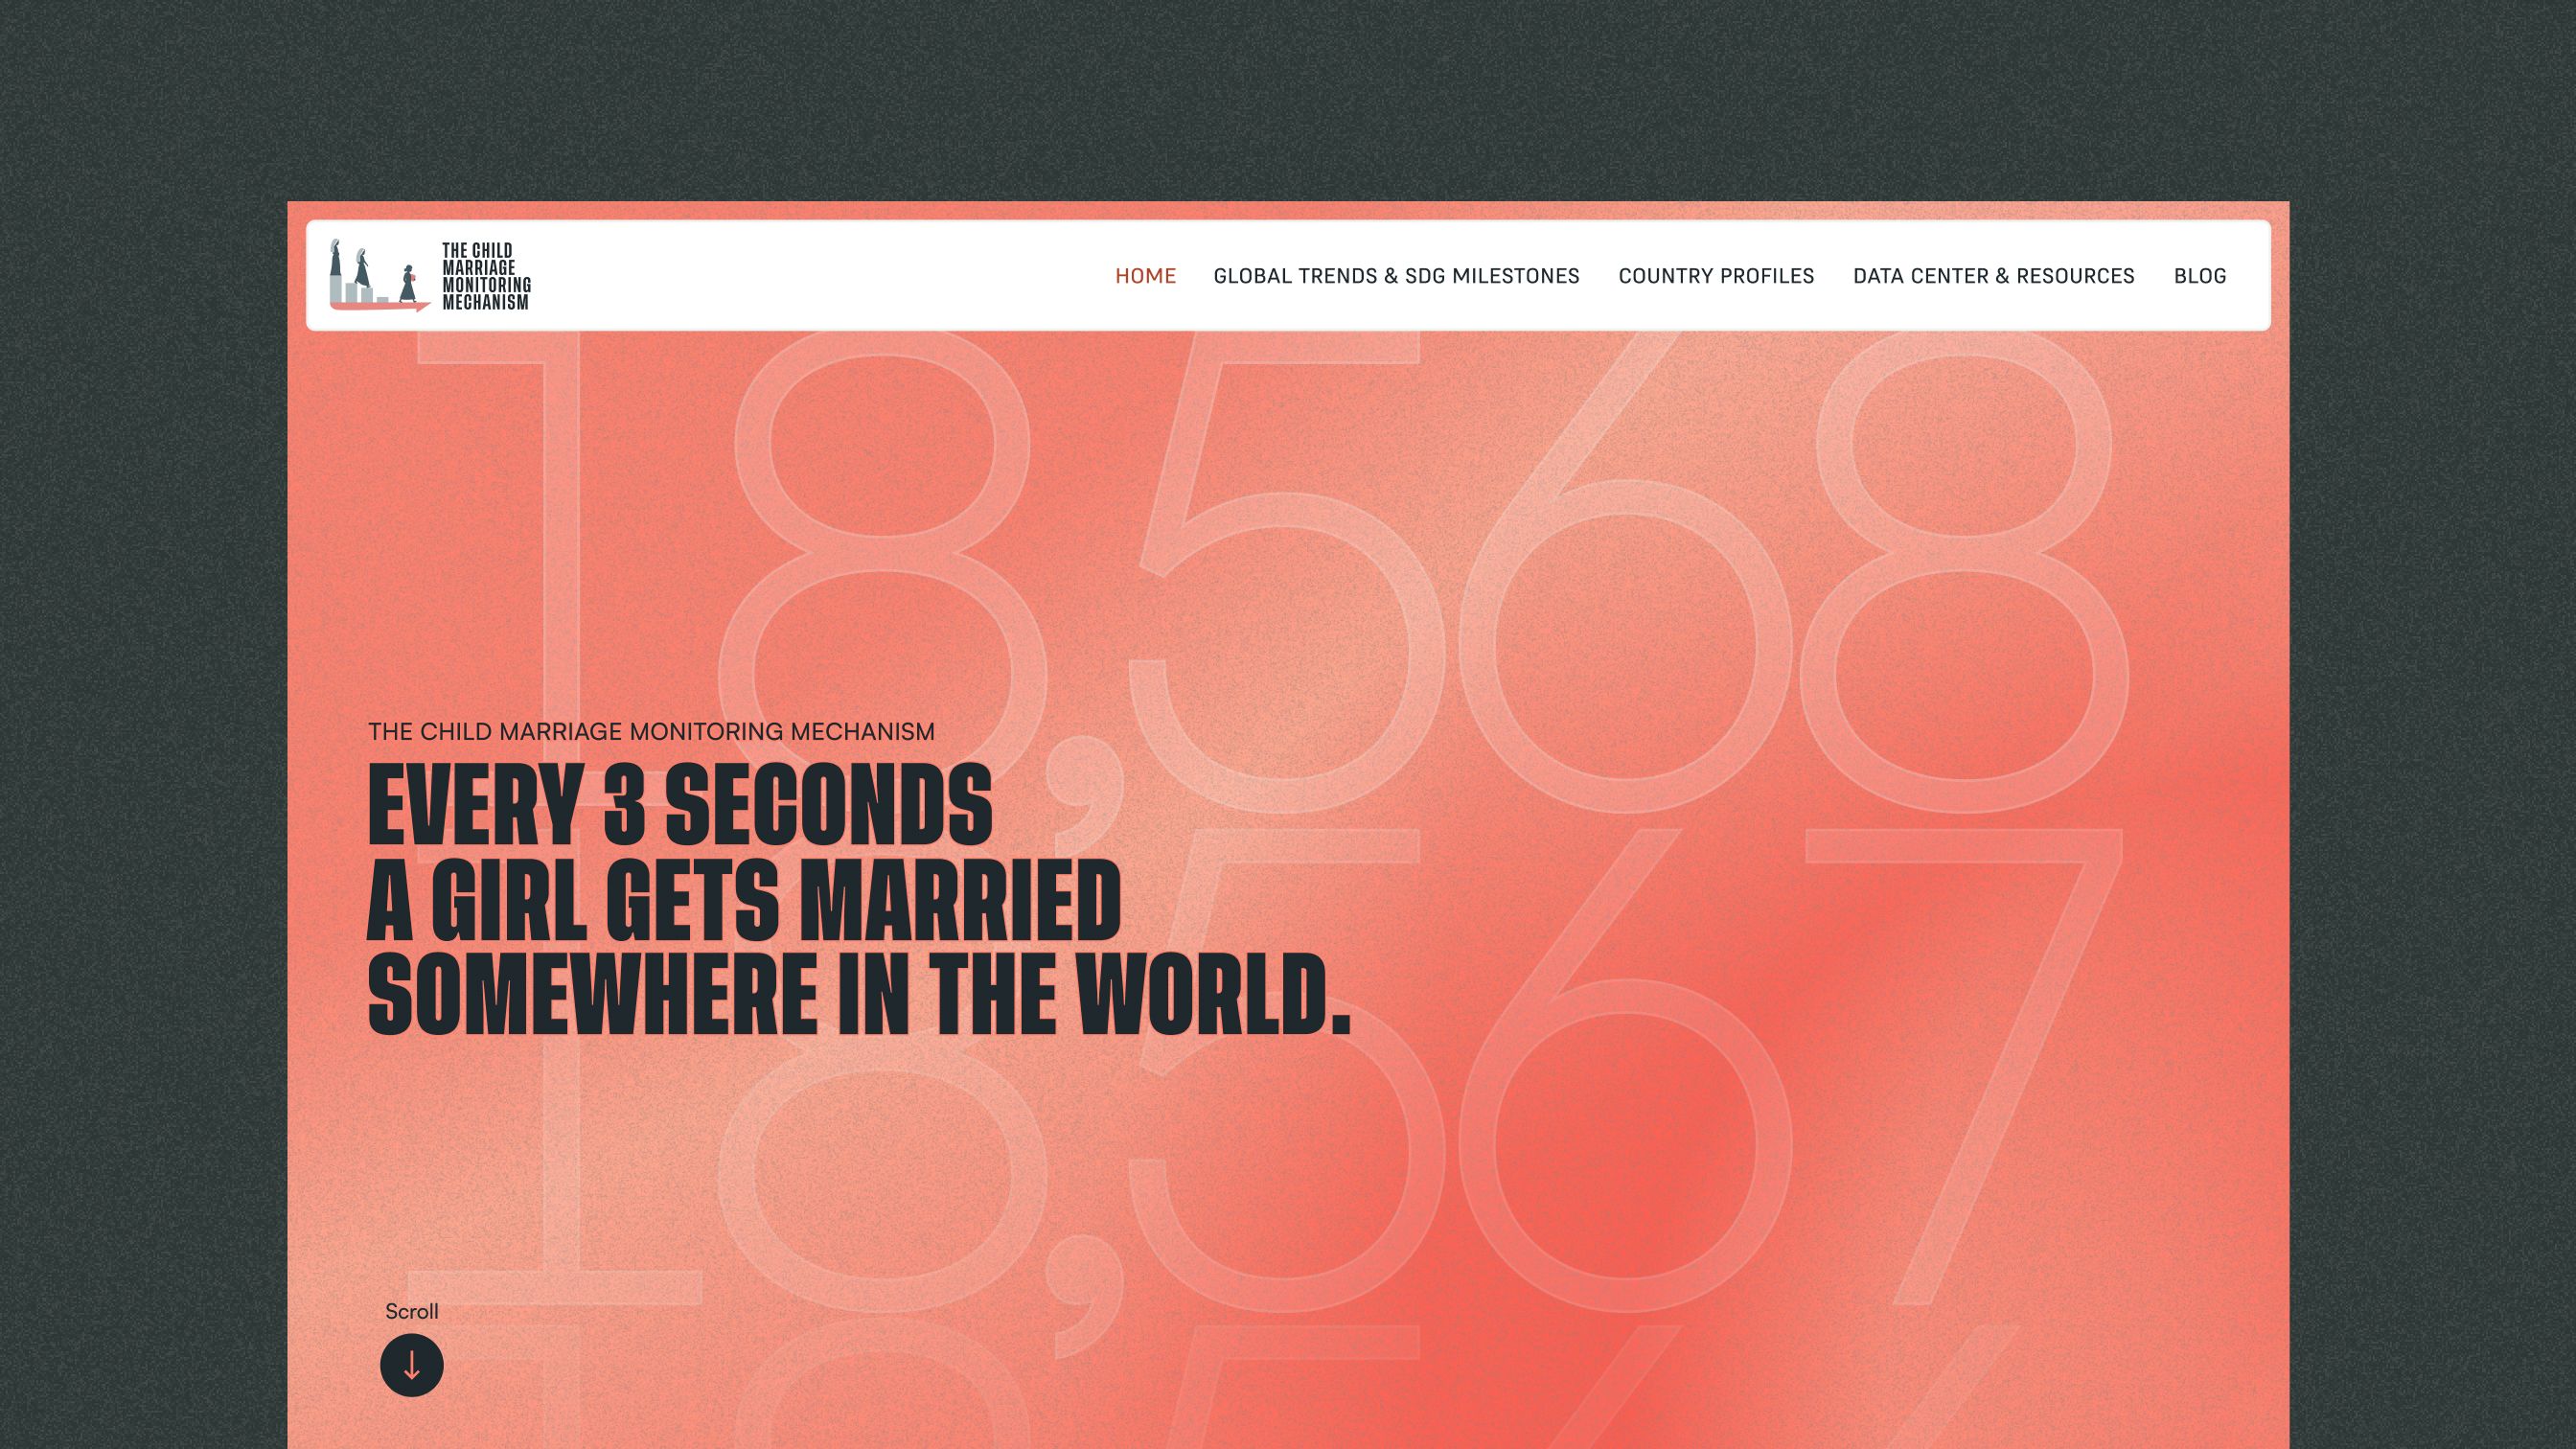
Showing the progress, not just the number. The portal holds regional and country data on child marriage. The challenge was to show it in three moments, ten years ago, today and 2030, so people can see where each place has been, where it is heading, and what changes if progress speeds up.
Communicating the scale of the problem. Child marriage is a much bigger problem than most people realize: nearly 650 million girls and women alive today were married in childhood, one in five young women worldwide. The challenge was to make that scale felt, not just stated.
Allowing deeper analysis by country. Beyond the global picture, policymakers, researchers and advocates need to look at a single country: how it compares with its region and the world, and who is most at risk inside it. The challenge was to give every country that depth while keeping one consistent way to read them all.
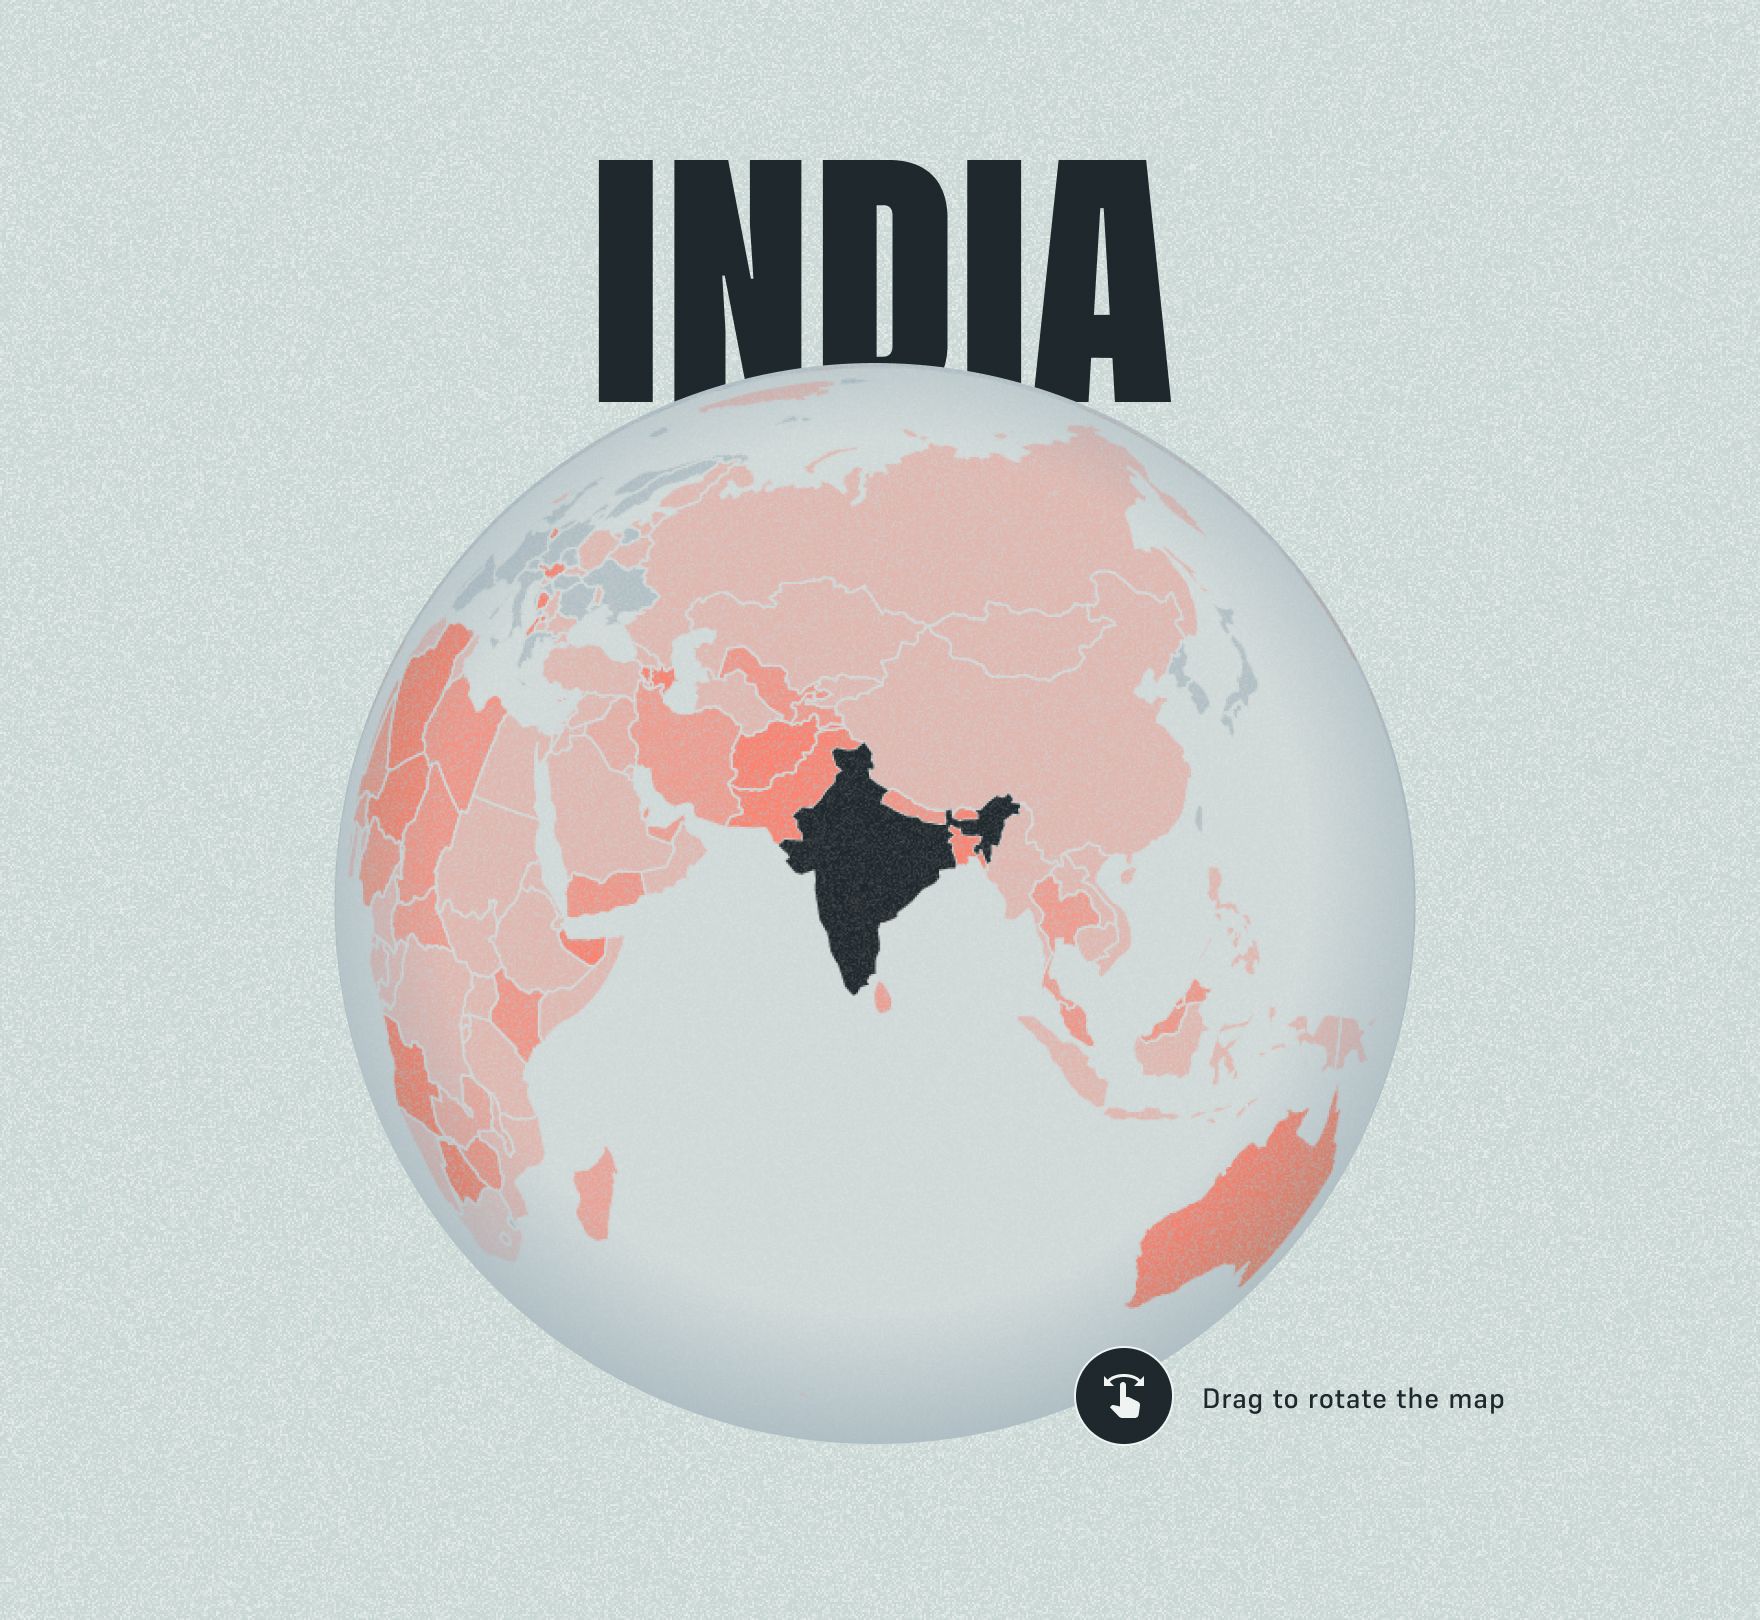
The path to ending child marriage
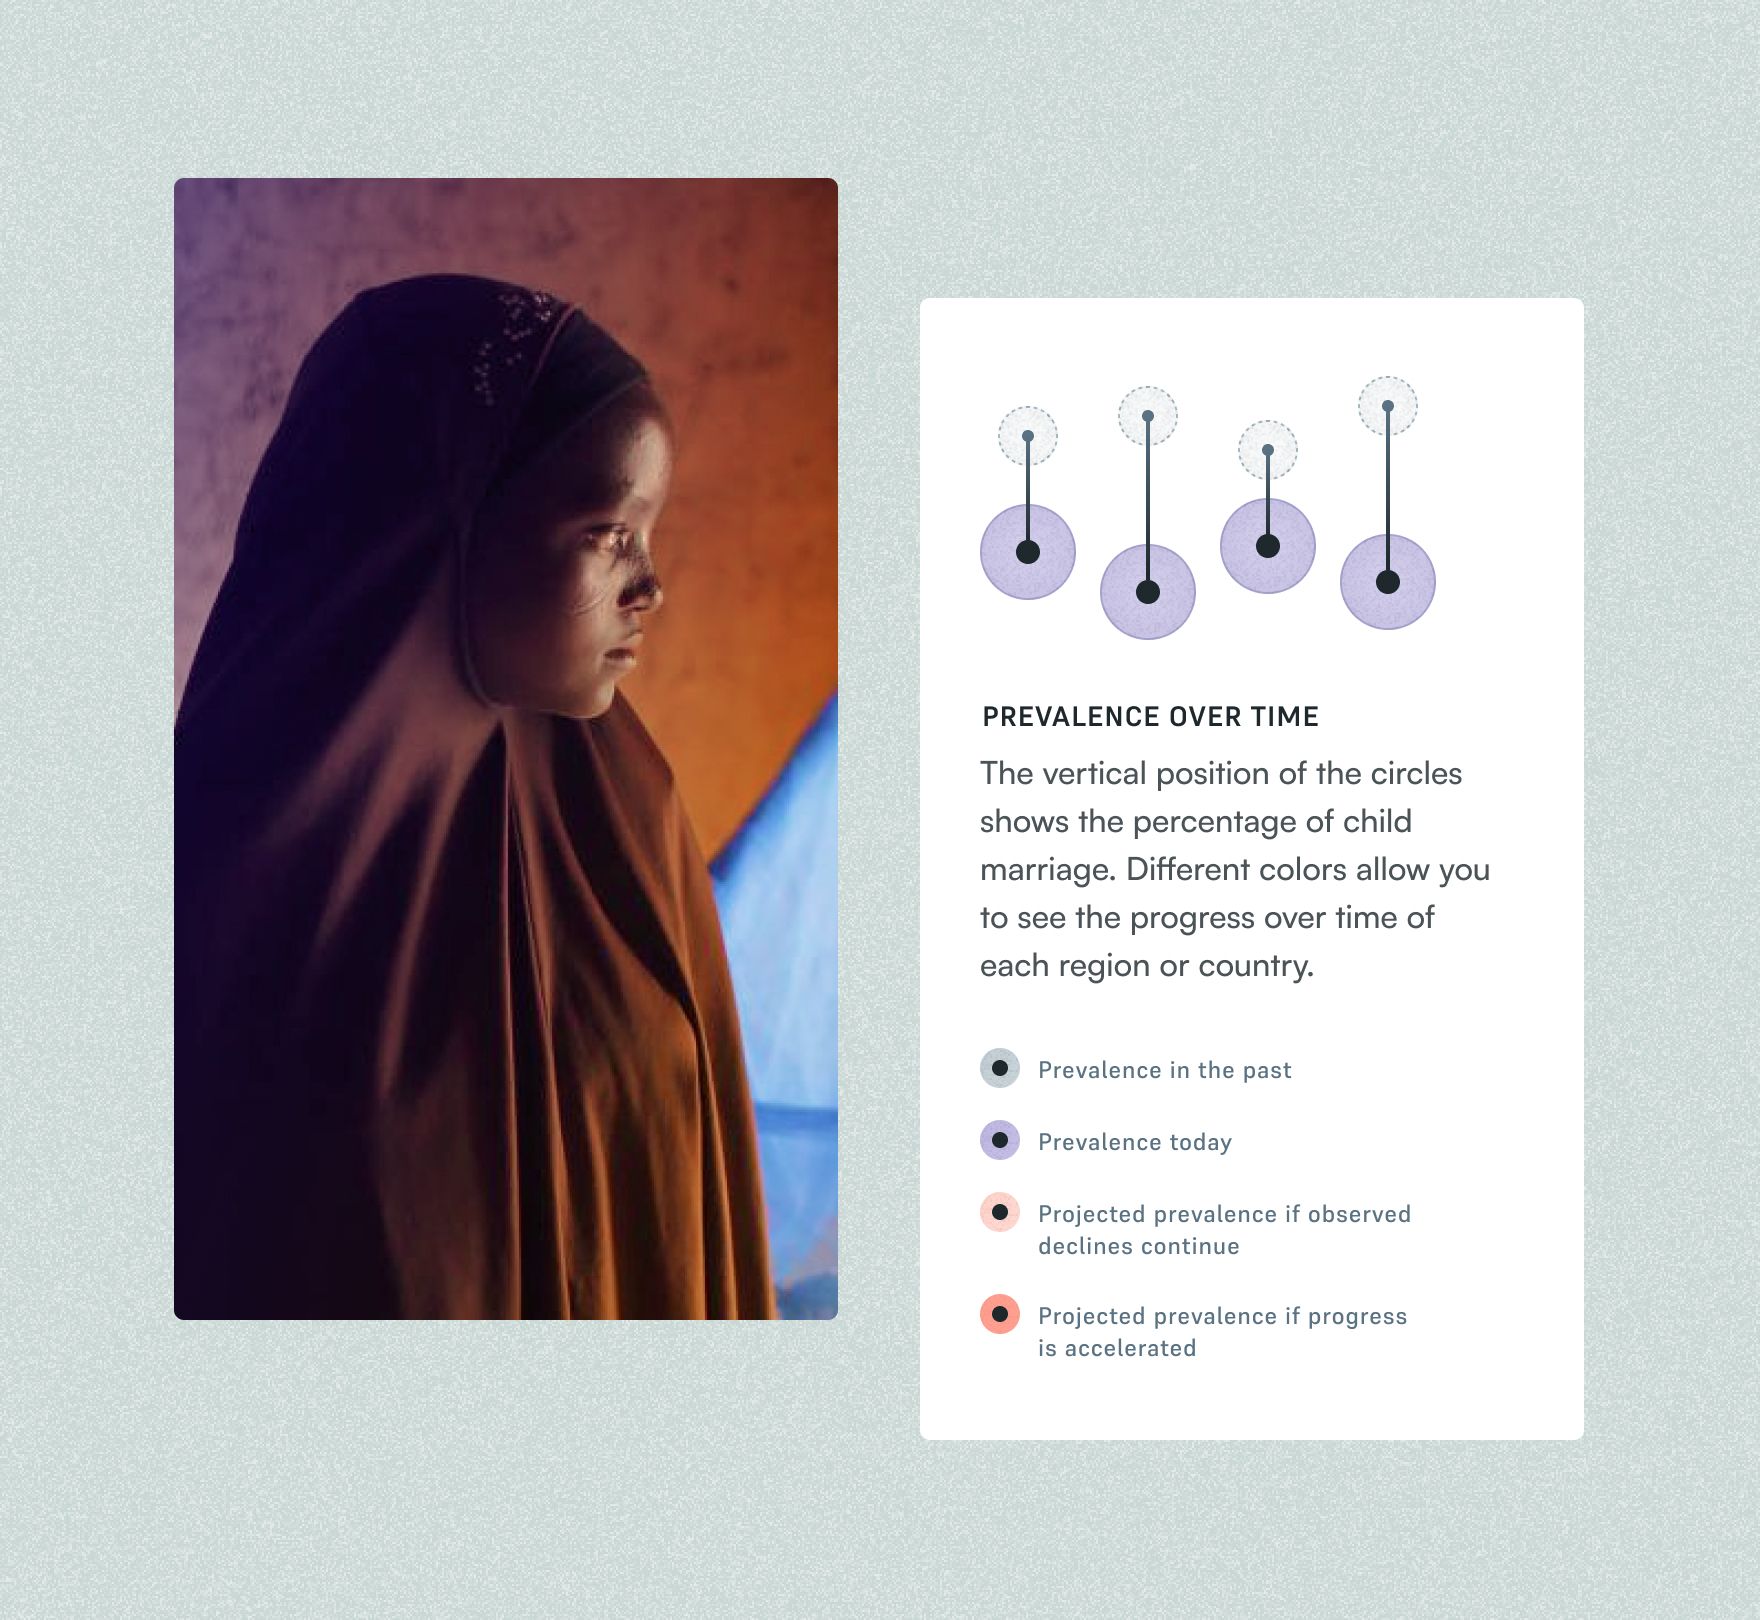
The main graphic is built around progress over time, not around the values themselves. Each country is a line joining where it was and where it is, so the ones that moved most stand out at a glance. Showing ten years ago, today and 2030 all at once would have crowded the chart, so it is interactive: a timeline lets people travel from the last decade to the present and on to 2030, shifting from cool grey to purple to red, the highlight color of the whole site and the color of the projections. The trade-off was giving up the full picture in a single glance, in exchange for clearer analysis of each moment and a stronger sense of the path.
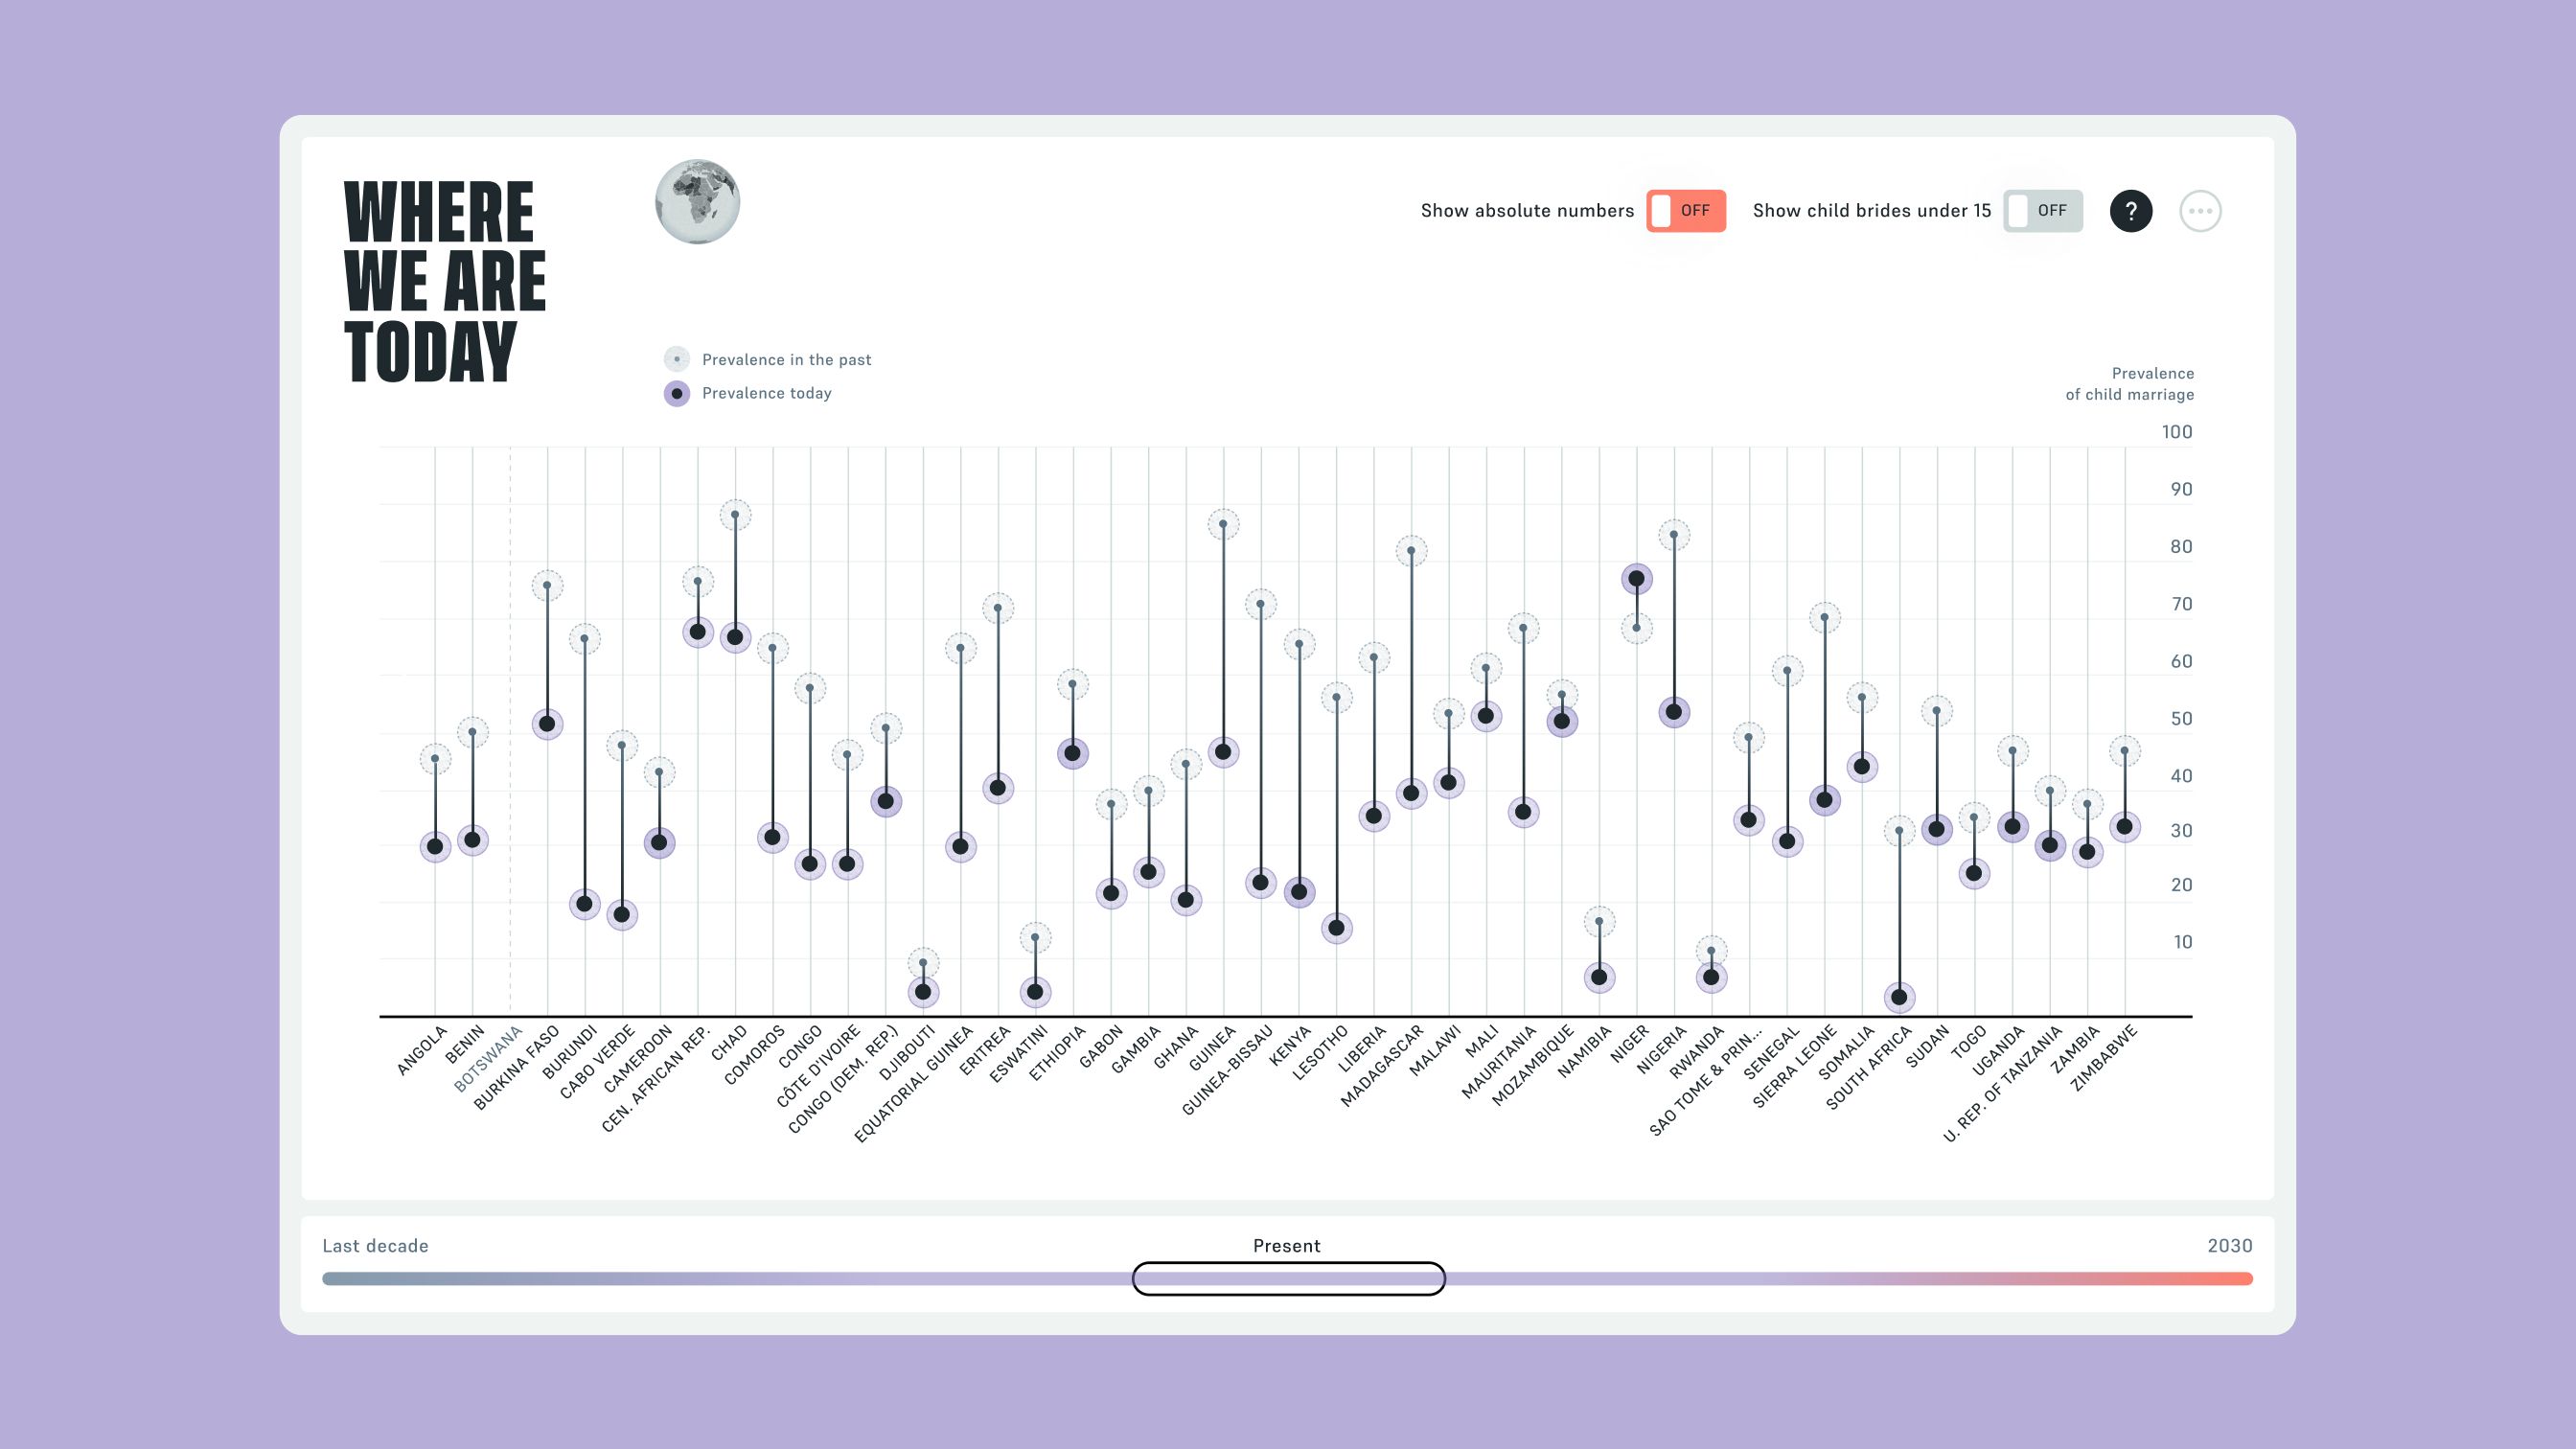
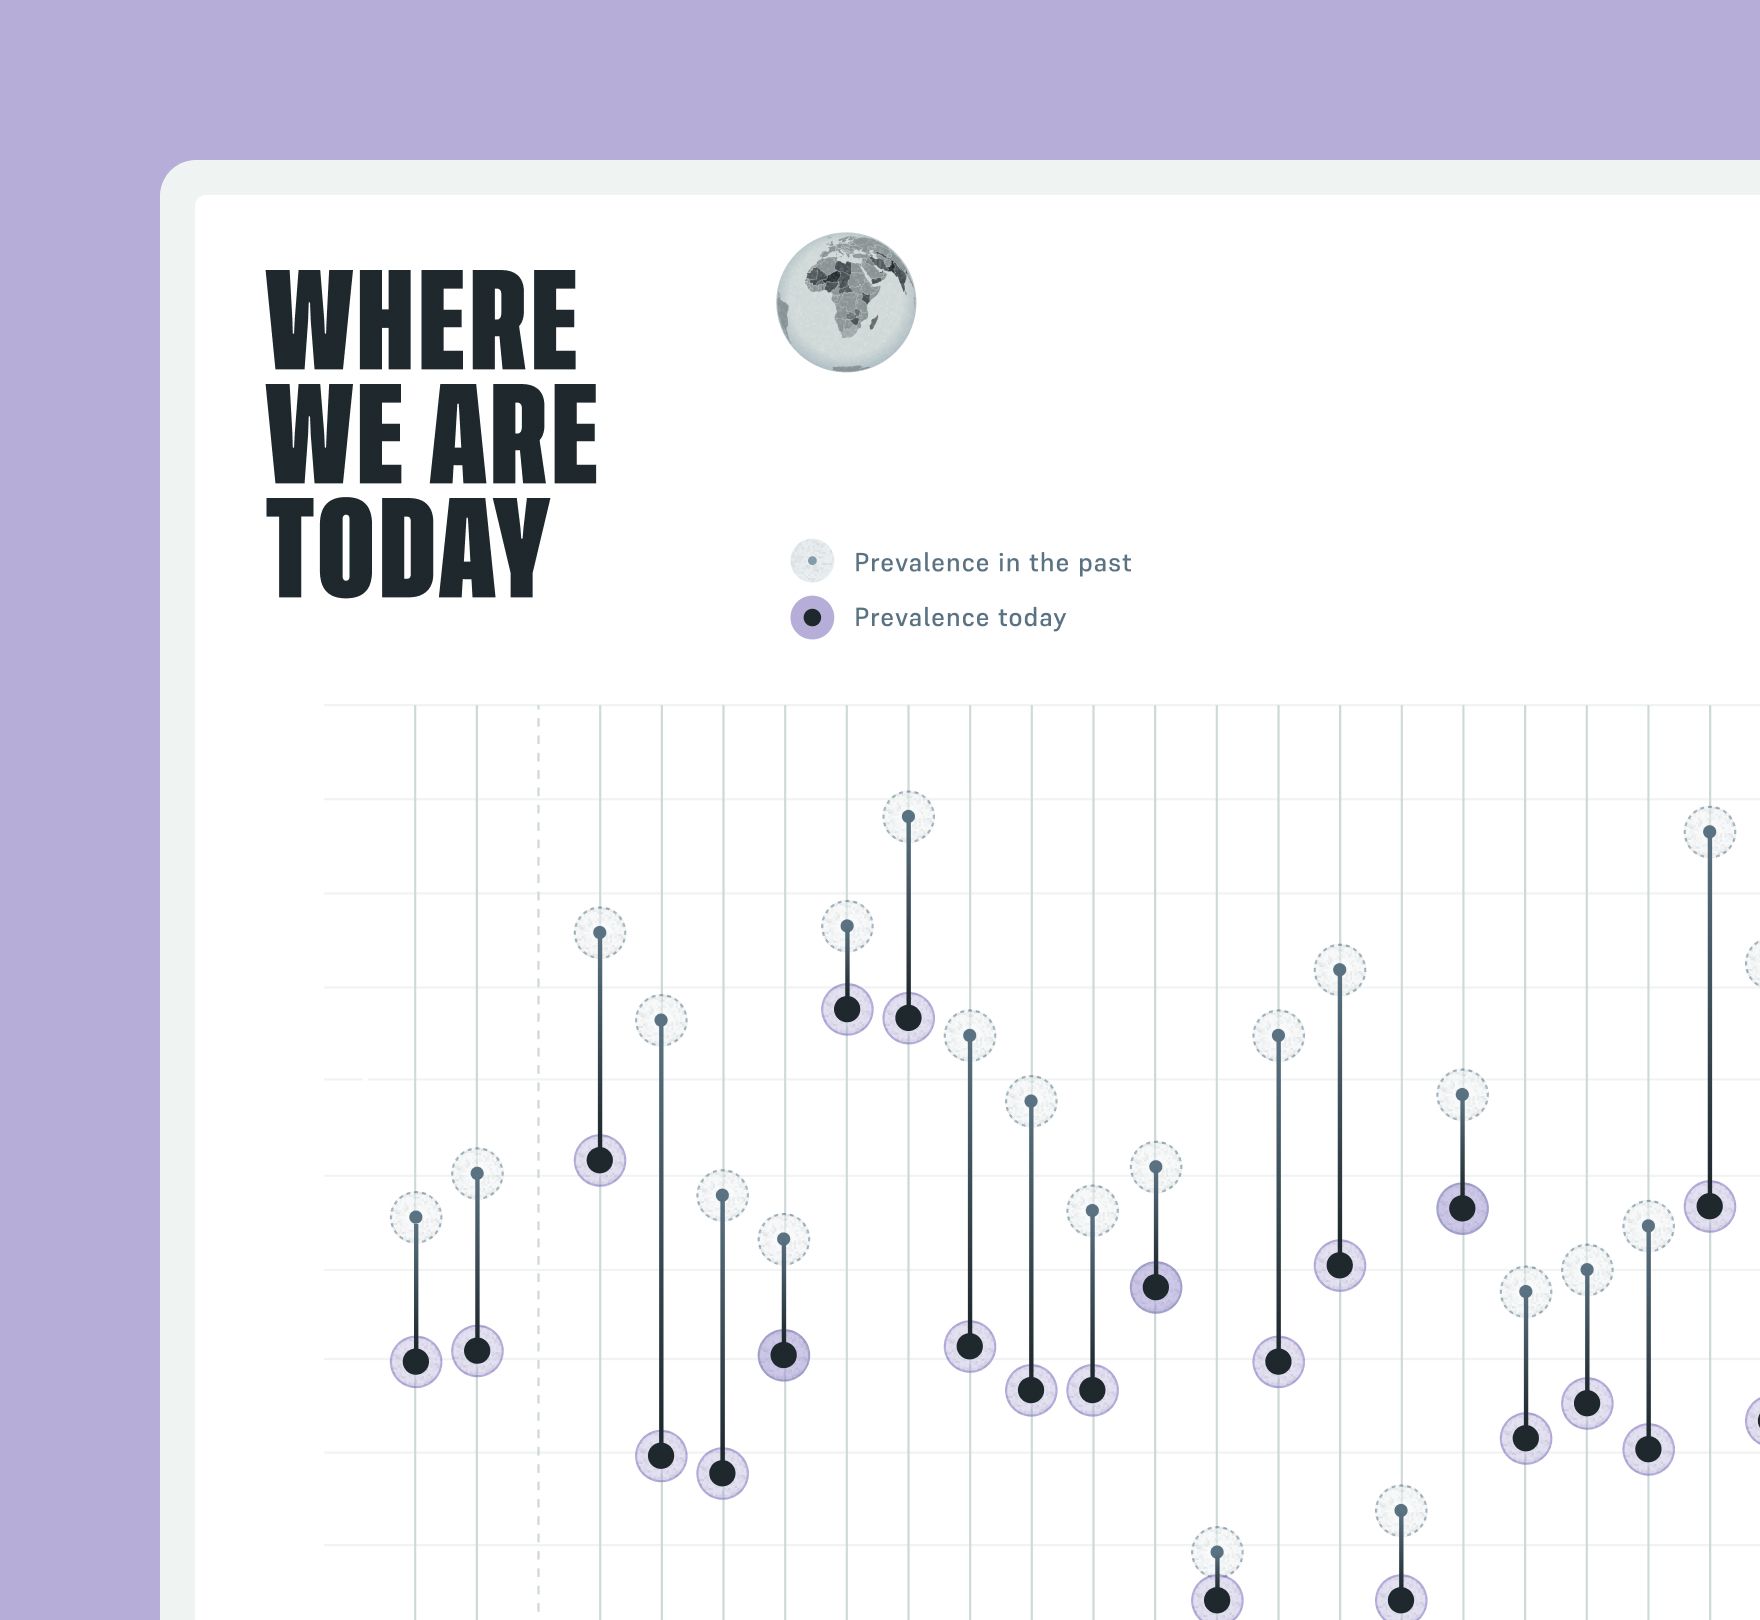
Each country is a vertical line joining two dots: a light one for its prevalence in the past and a dark one for today. Toggles switch to absolute numbers or to child brides under 15, and a question mark explains how to read the chart.
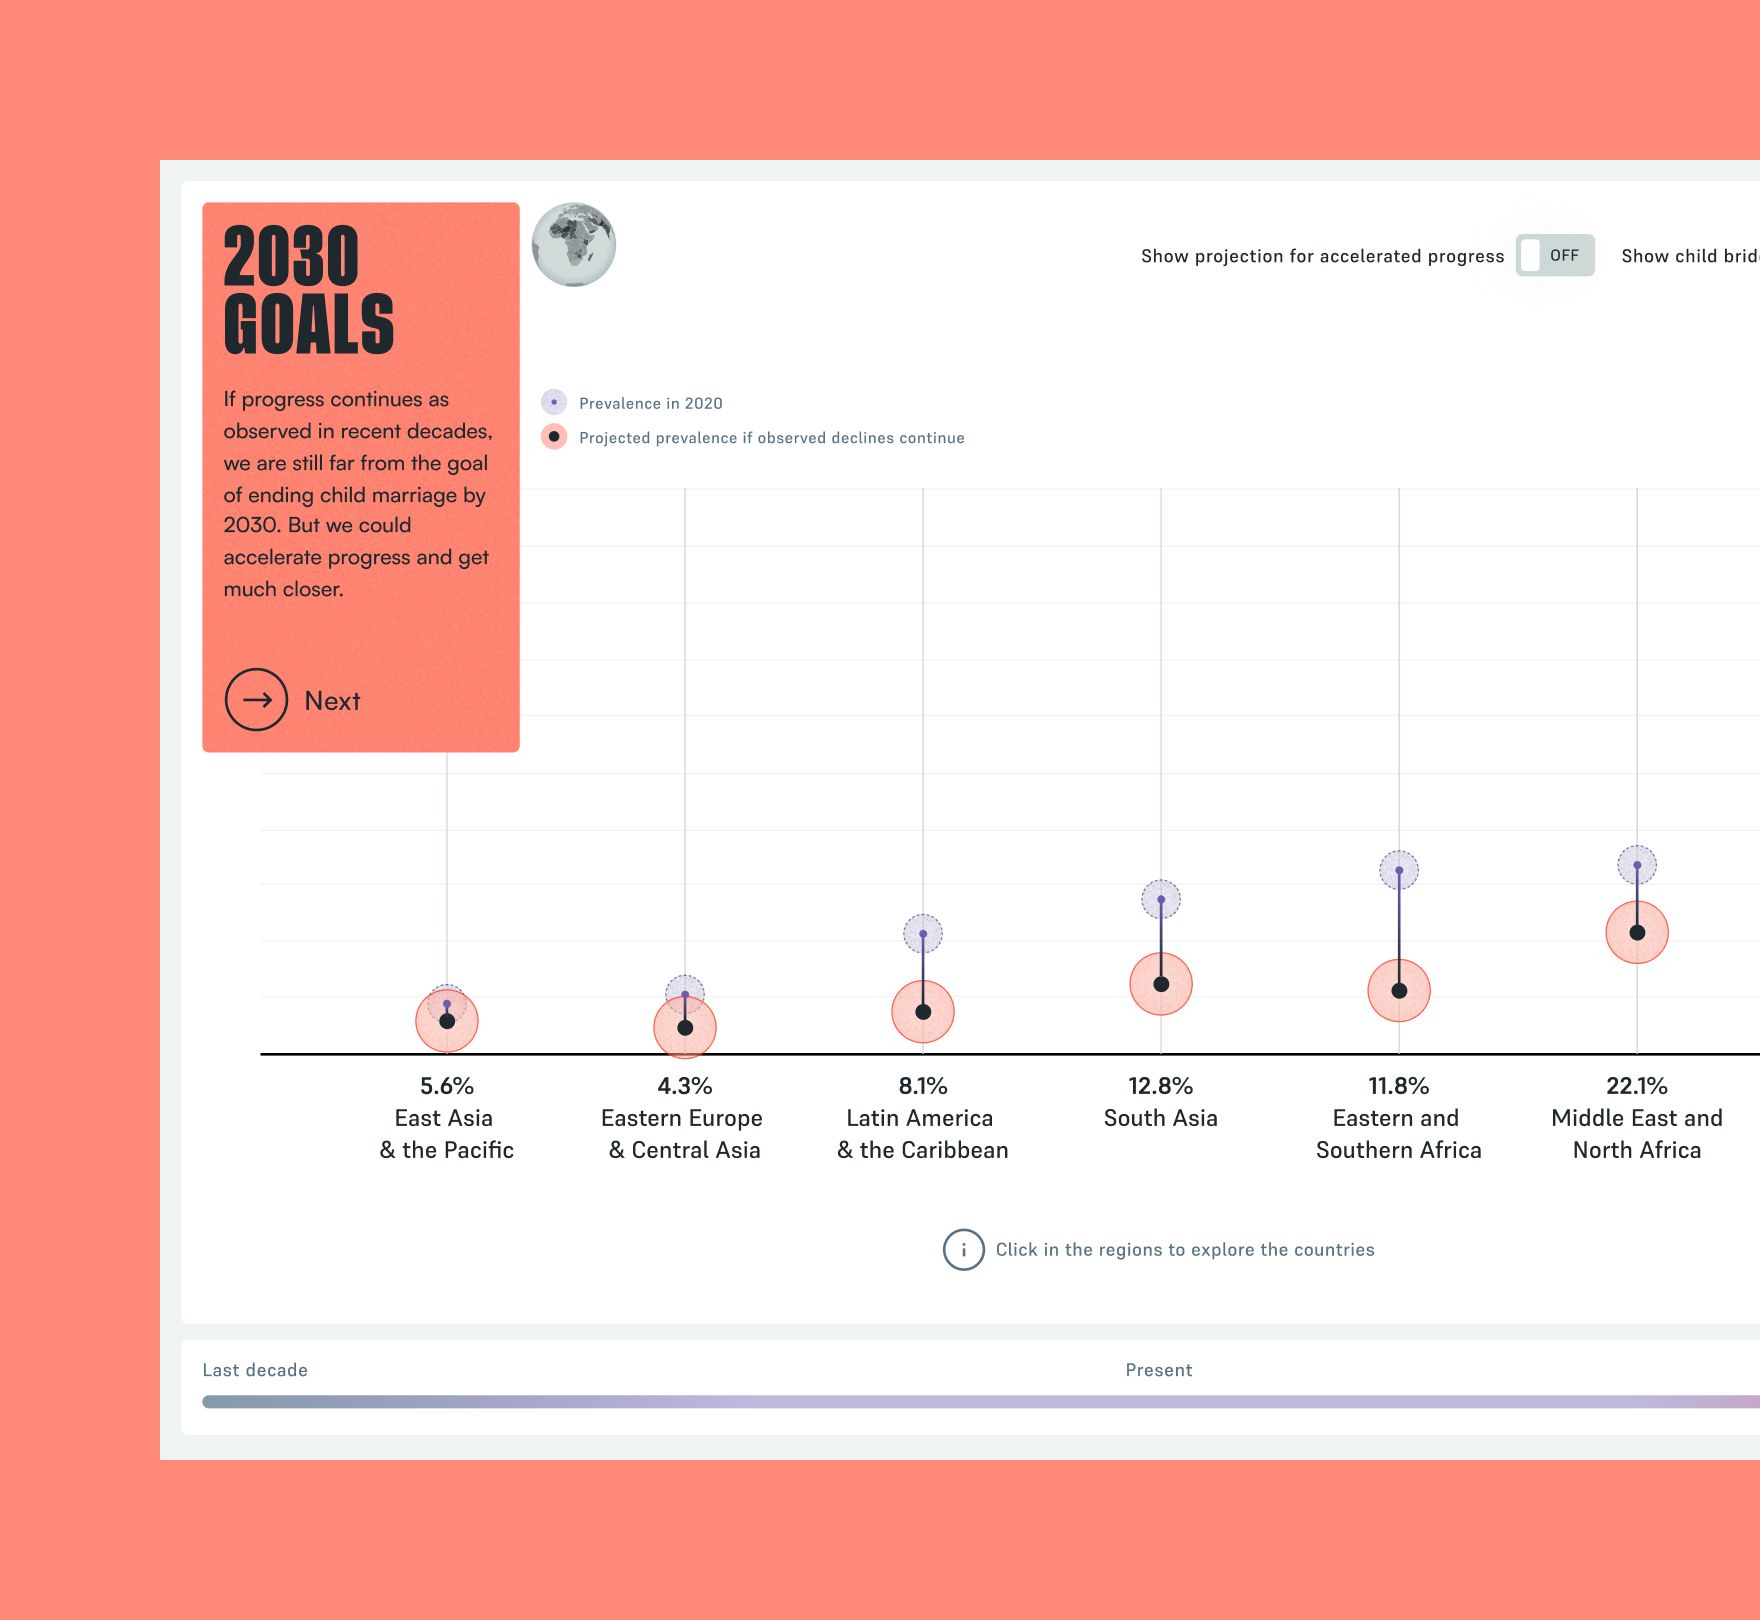
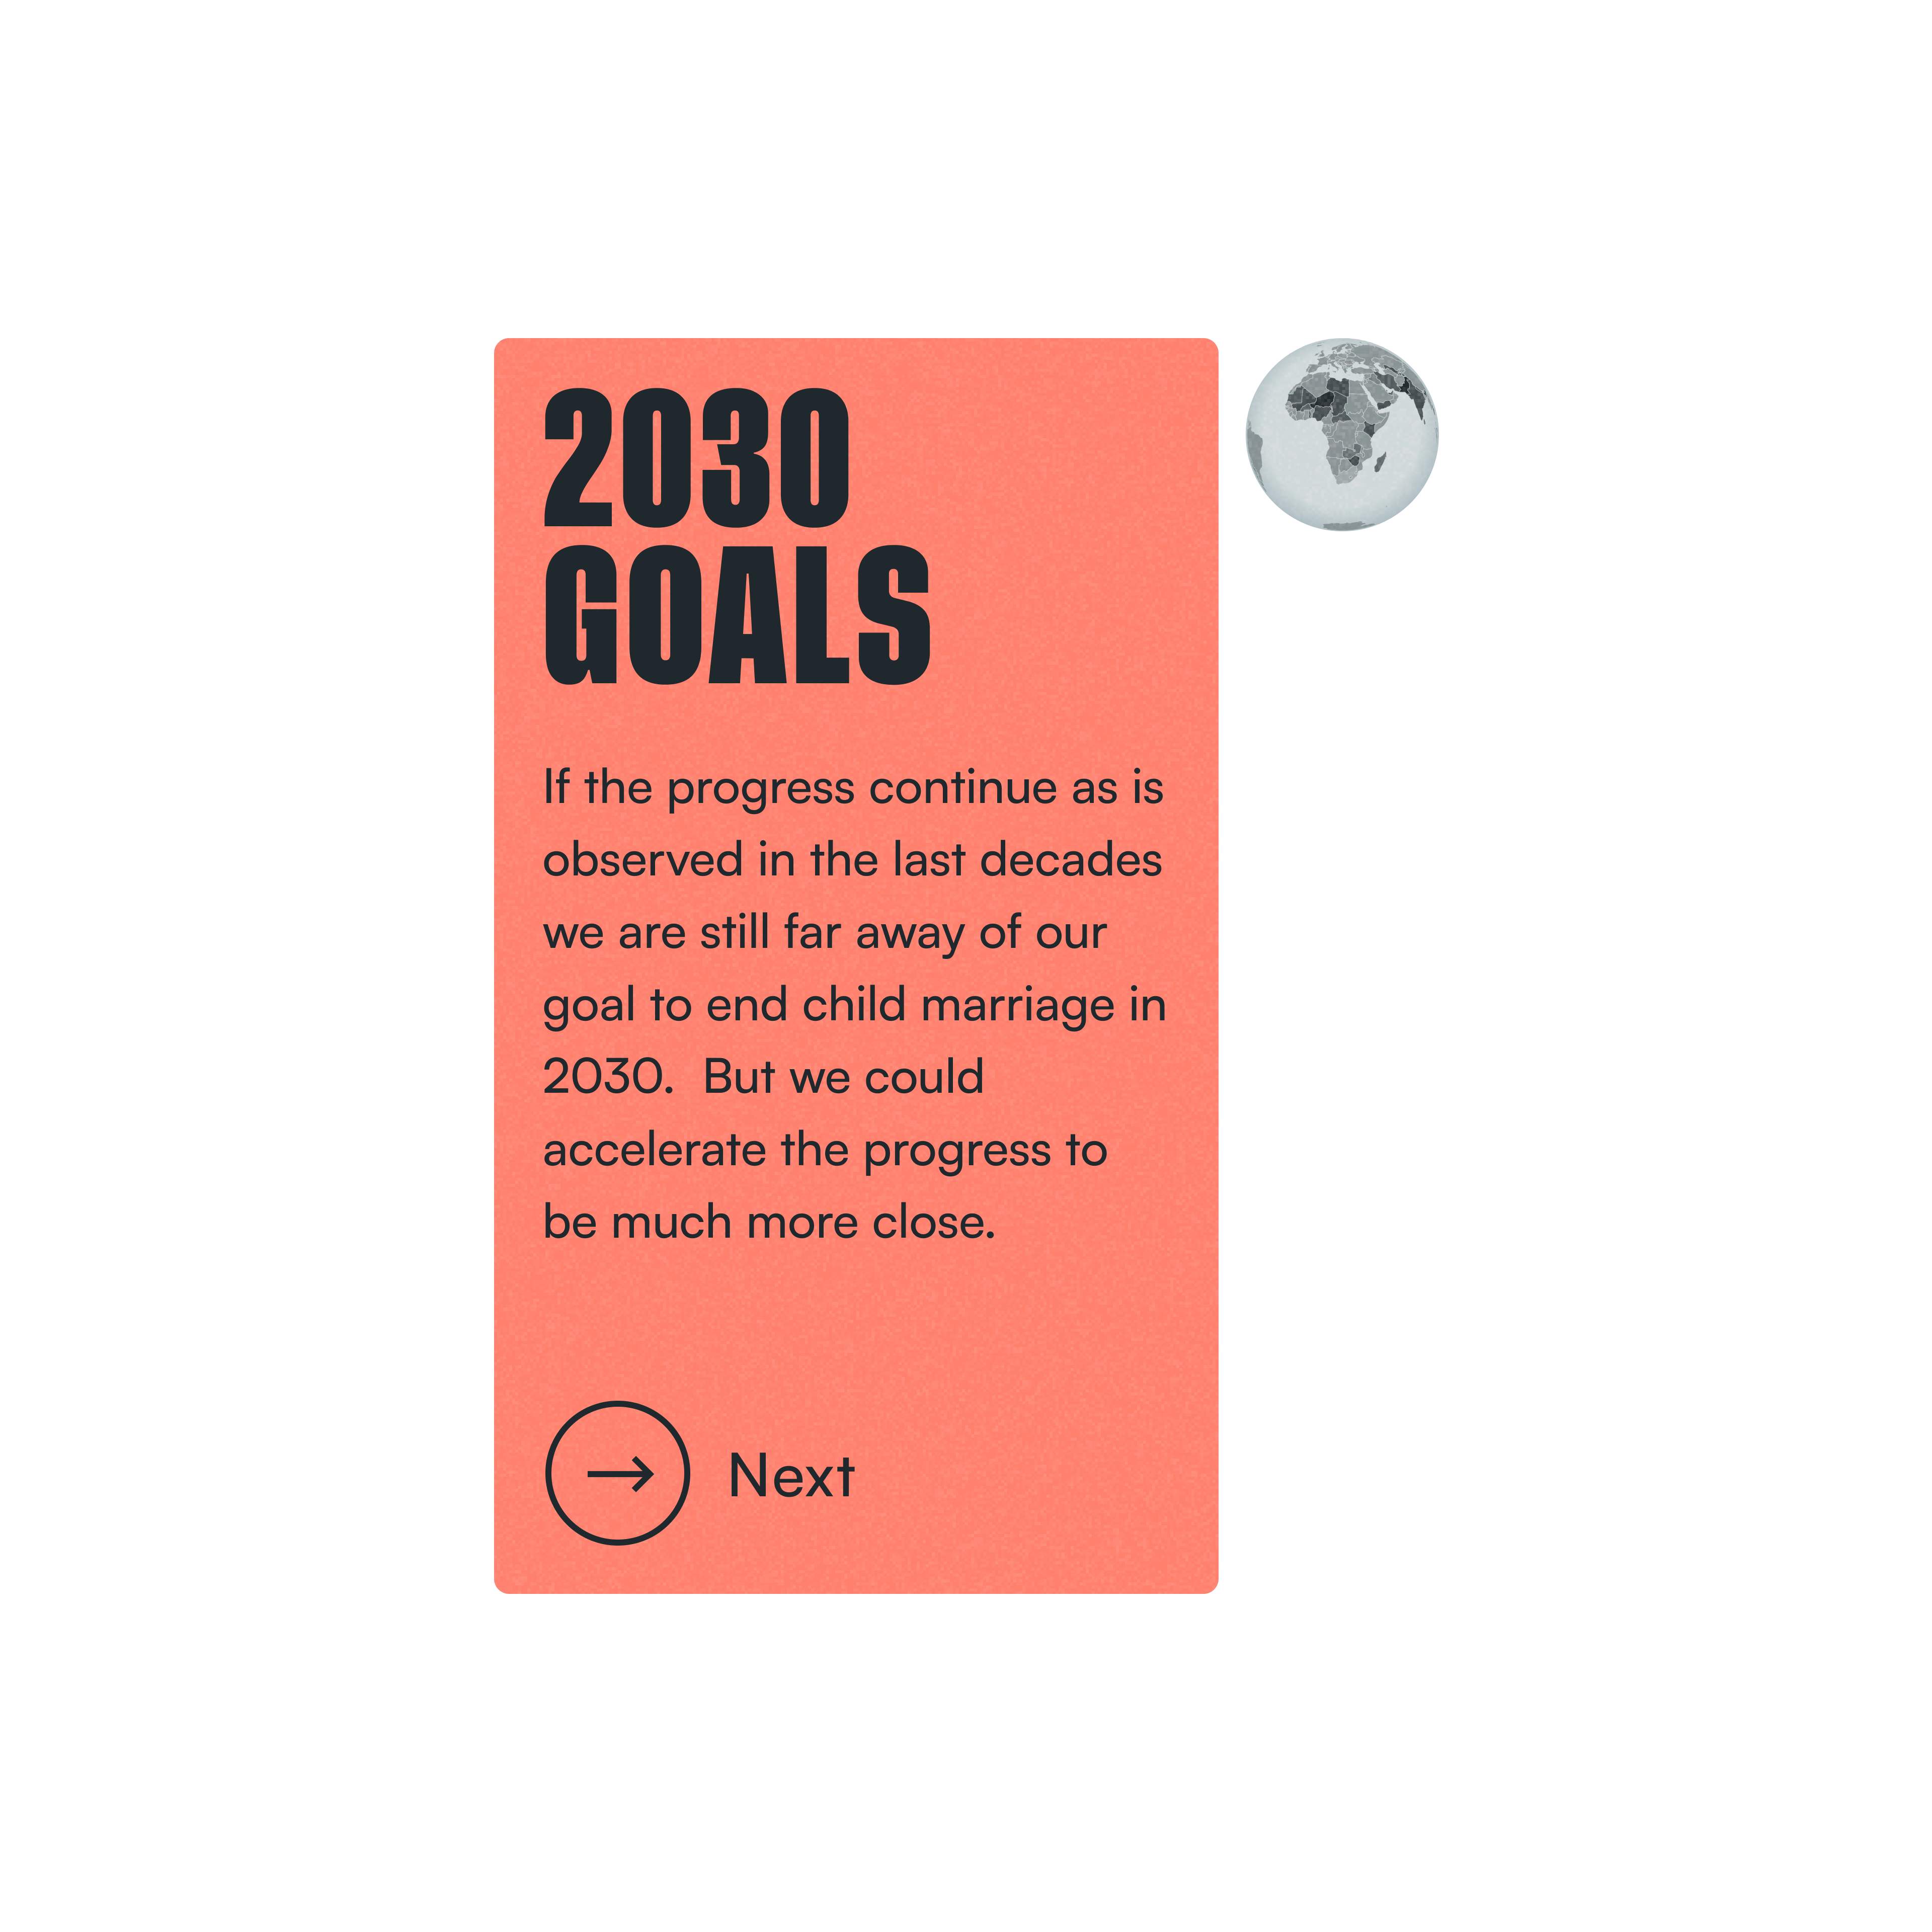
Moving the timeline to 2030 switches the chart to projections, and red takes over. The red dots show the projected prevalence if observed declines continue, and a short card explains that at this pace the goal is still far away. A toggle adds the accelerated scenario so both futures can be compared, and clicking a region opens its countries.
A pulse you can feel
A percentage is easy to read and easy to forget, so the scale of child marriage needed more than charts. The design pairs the data with a pulse, with perspectives and with people: a counter that moves every time a girl is married, which turns the numbers into a sense of urgency, cards that look at the problem from different angles, and stories that tie each figure to the lives behind it.
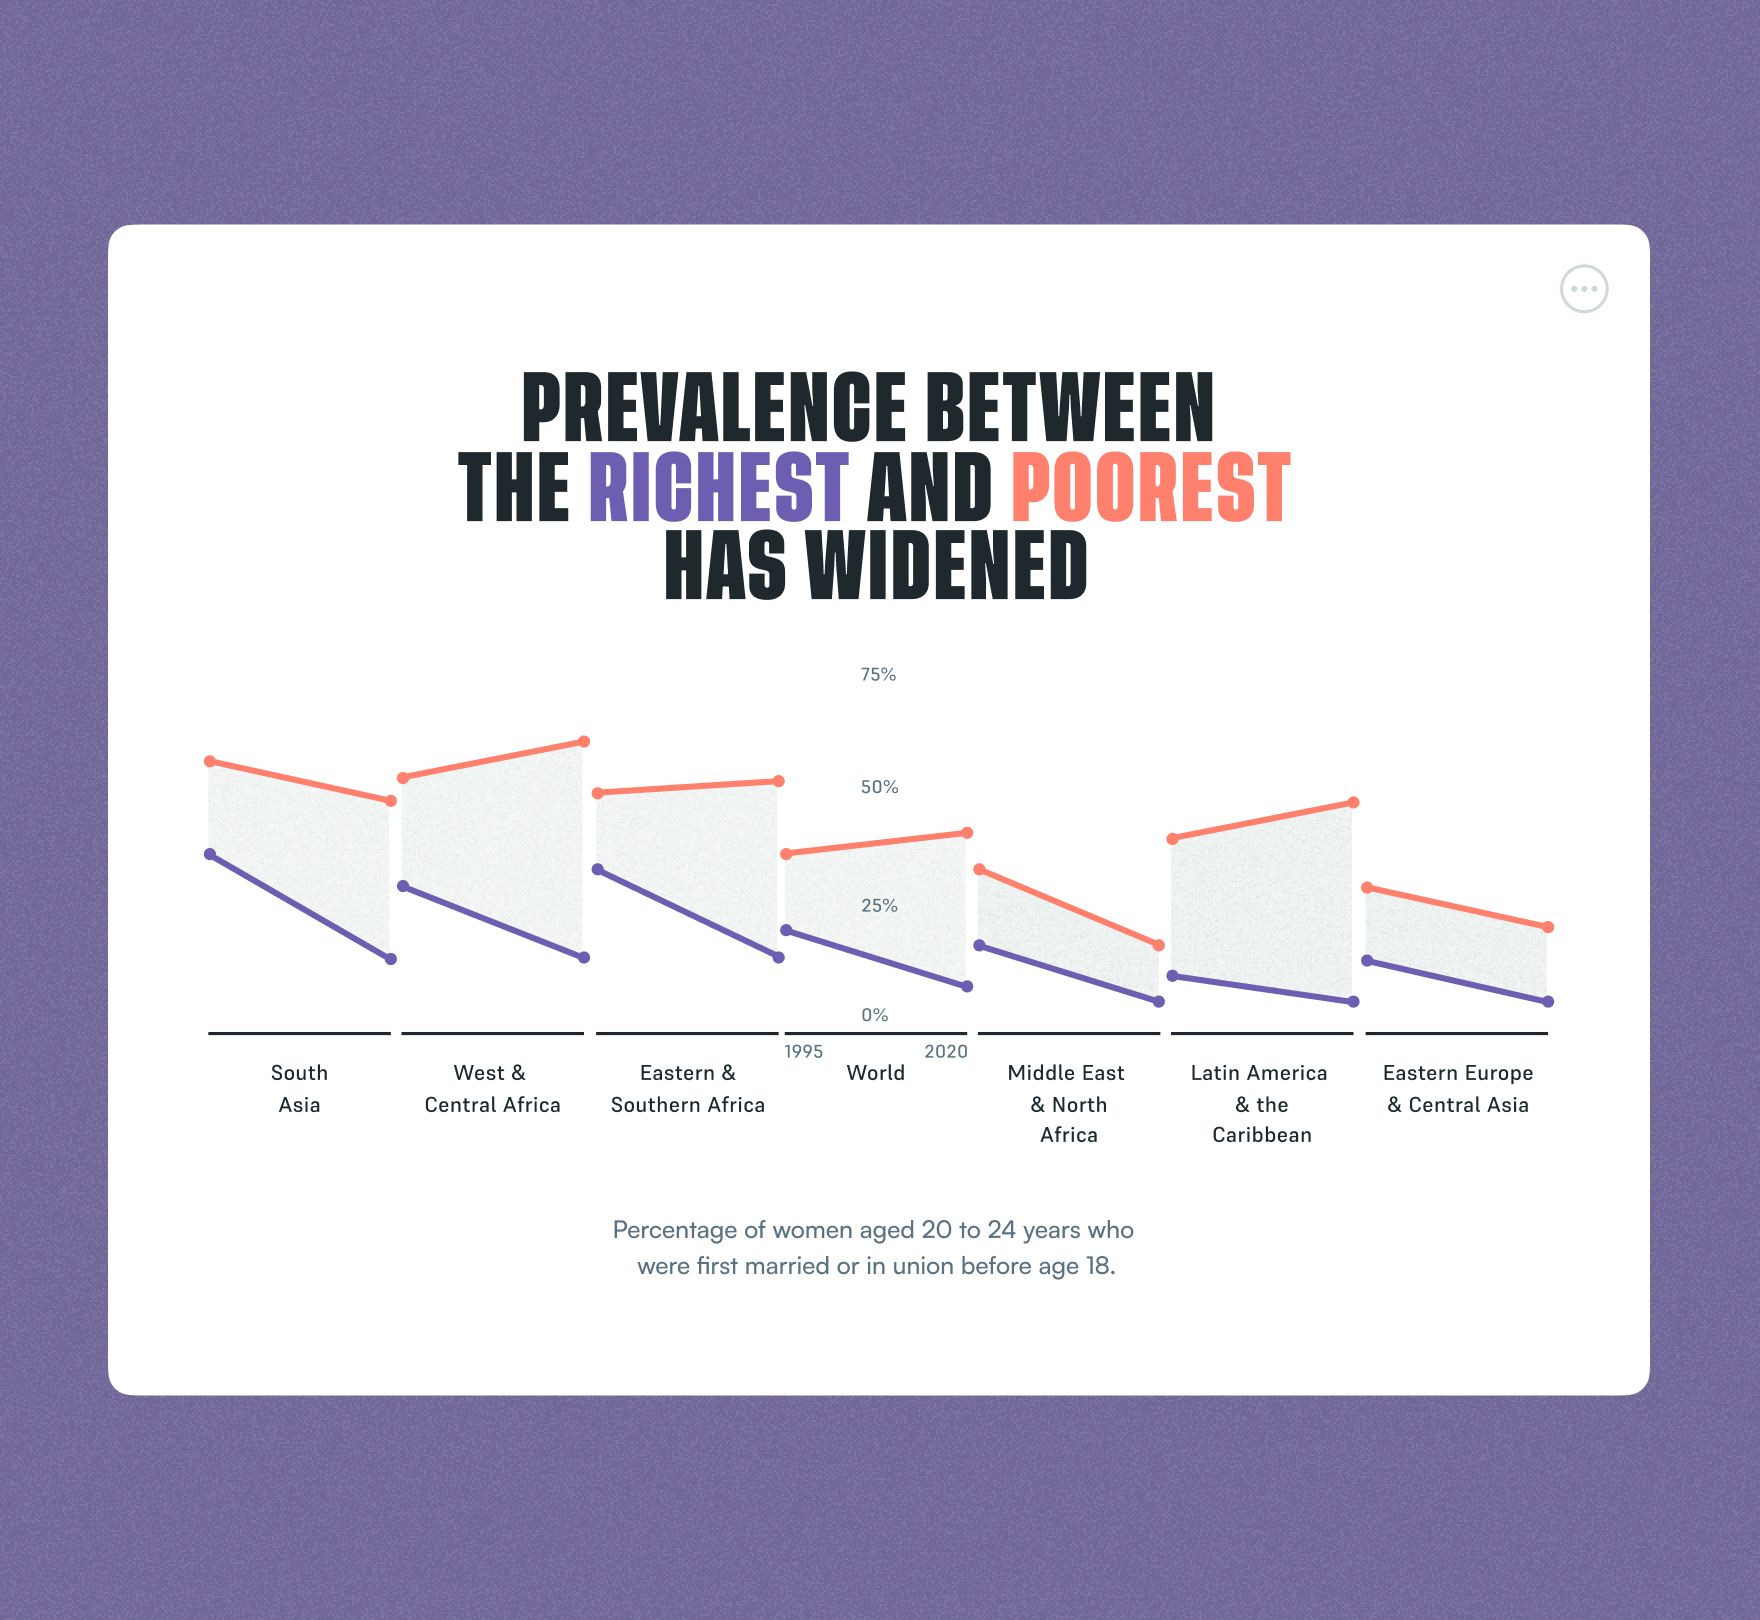
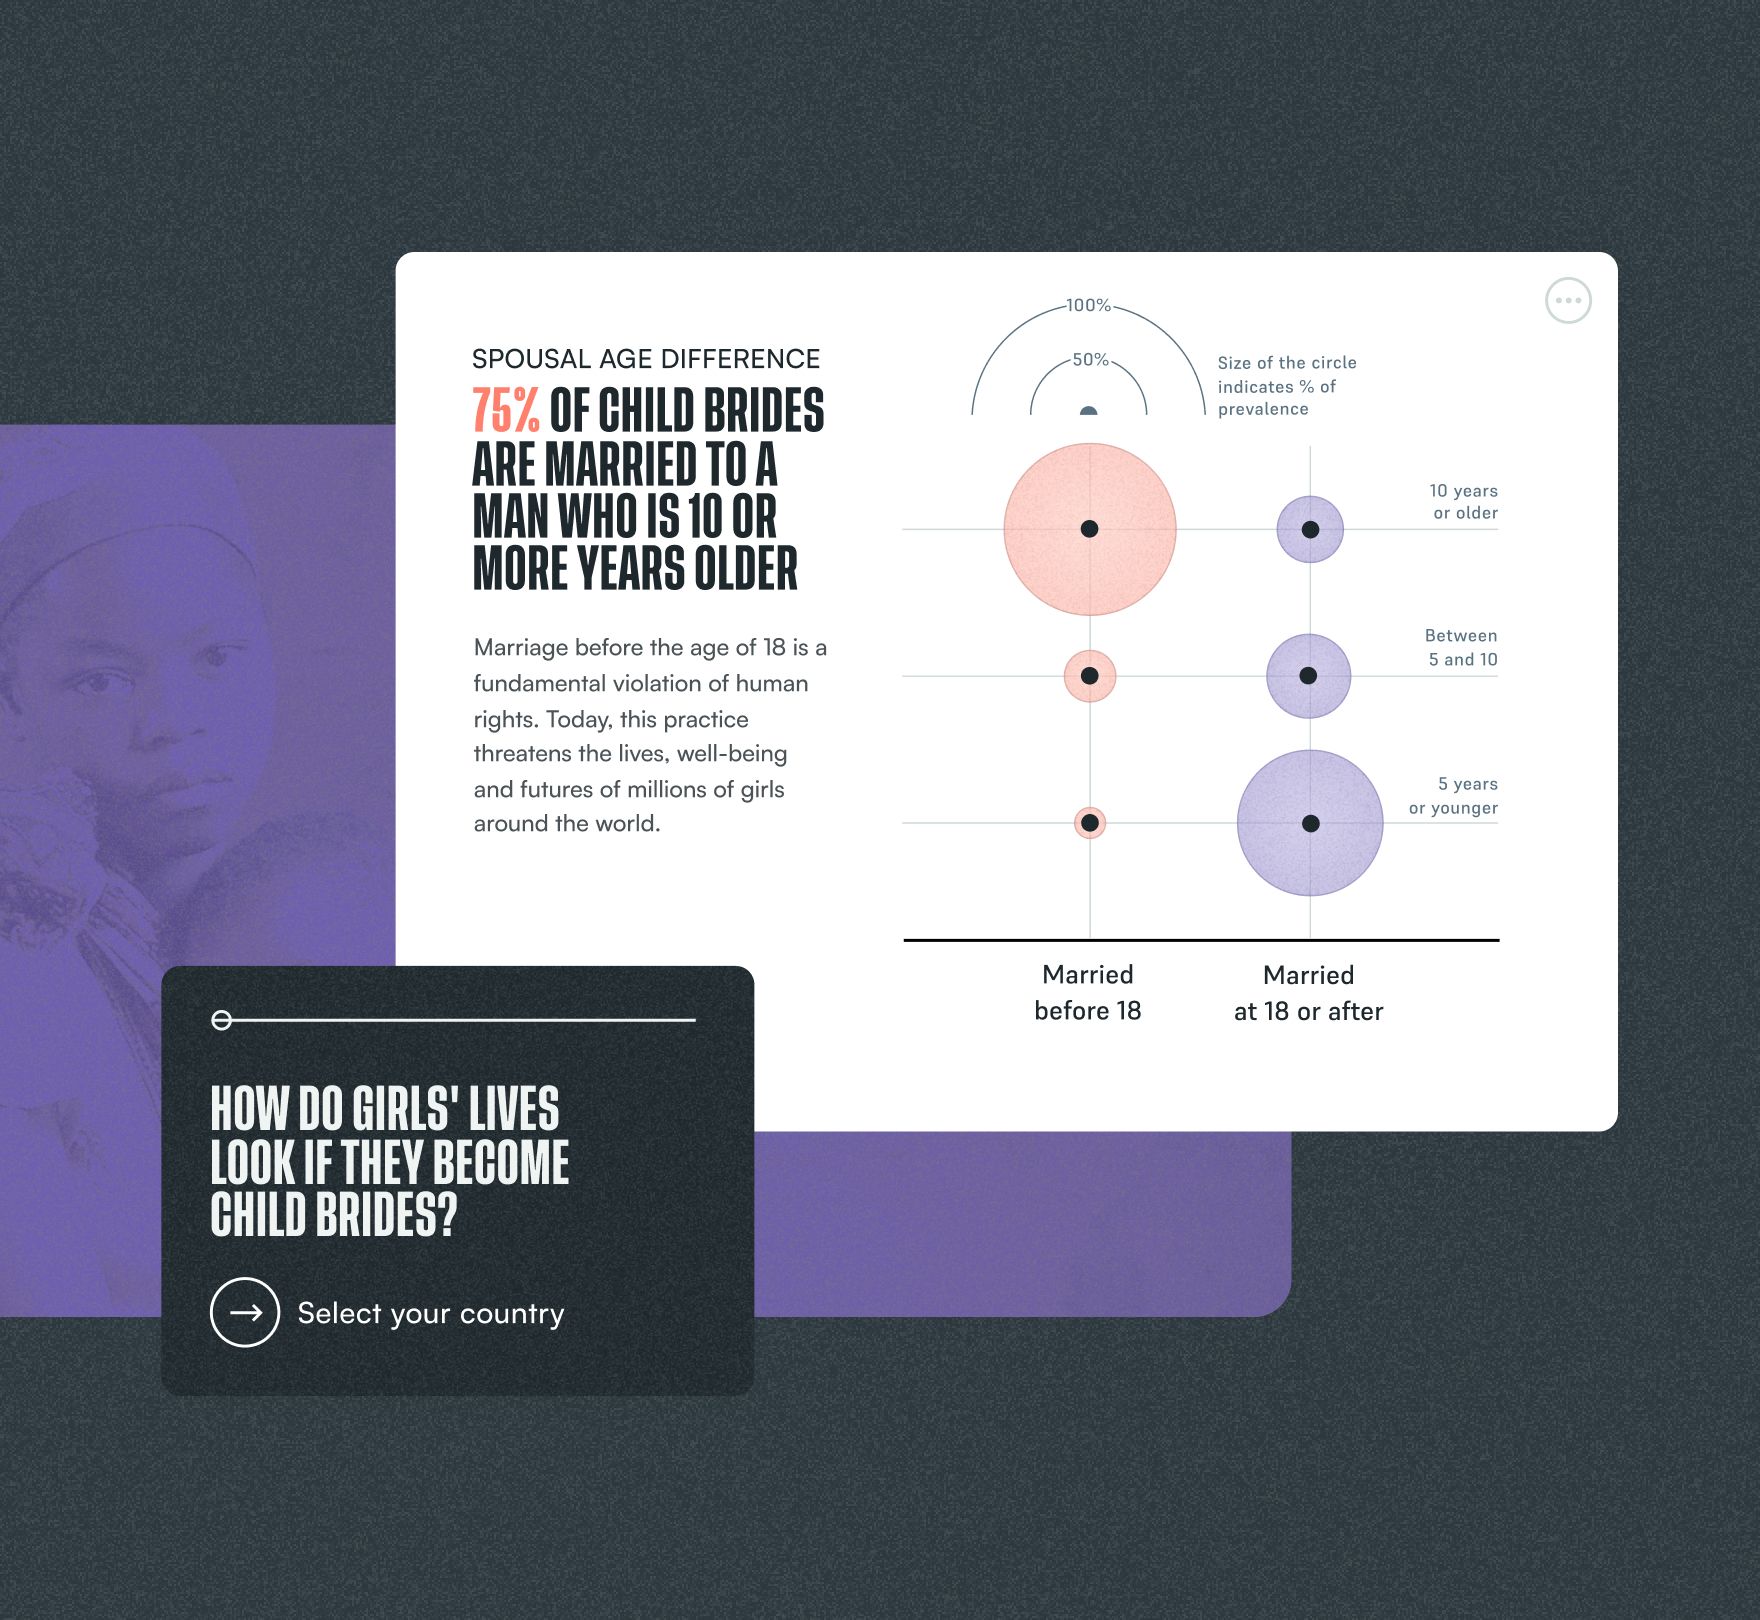
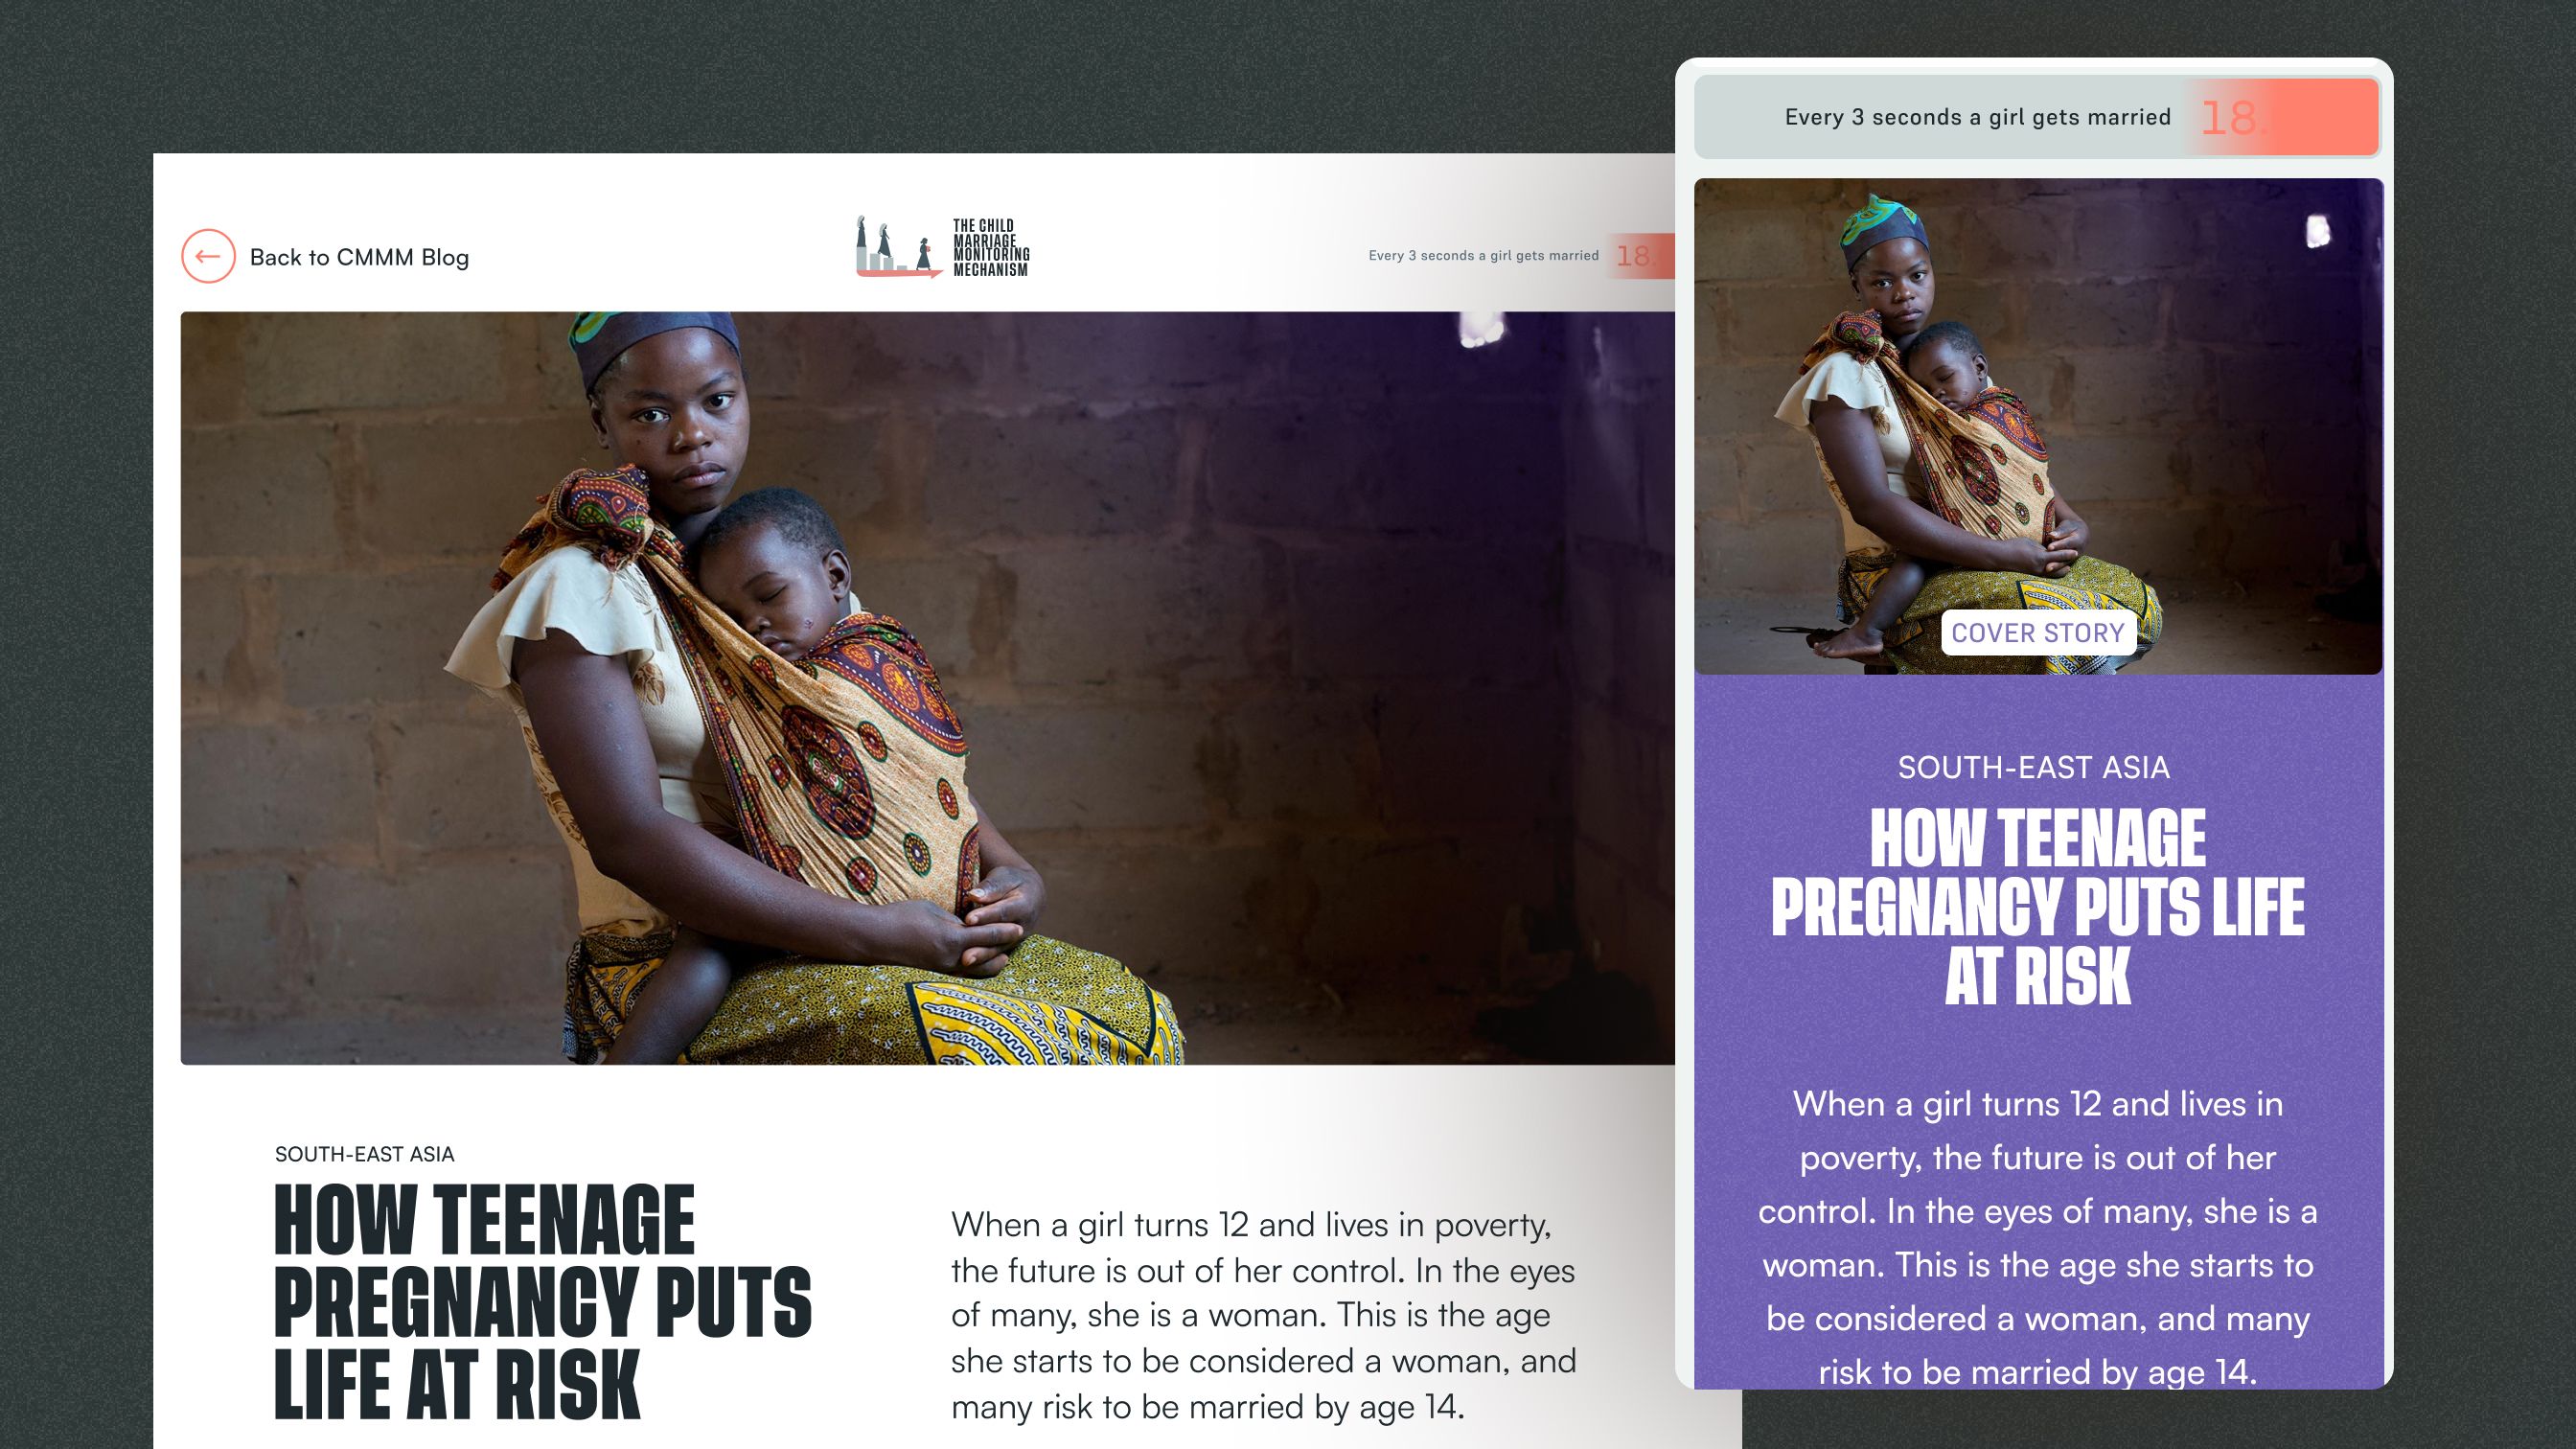
Alongside the main graphic, the site is full of cards that look at the problem from different perspectives, from the wealth gap to teenage pregnancy. Each pairs a strong headline with a simple chart, and together they complement the hard data with the context around it.
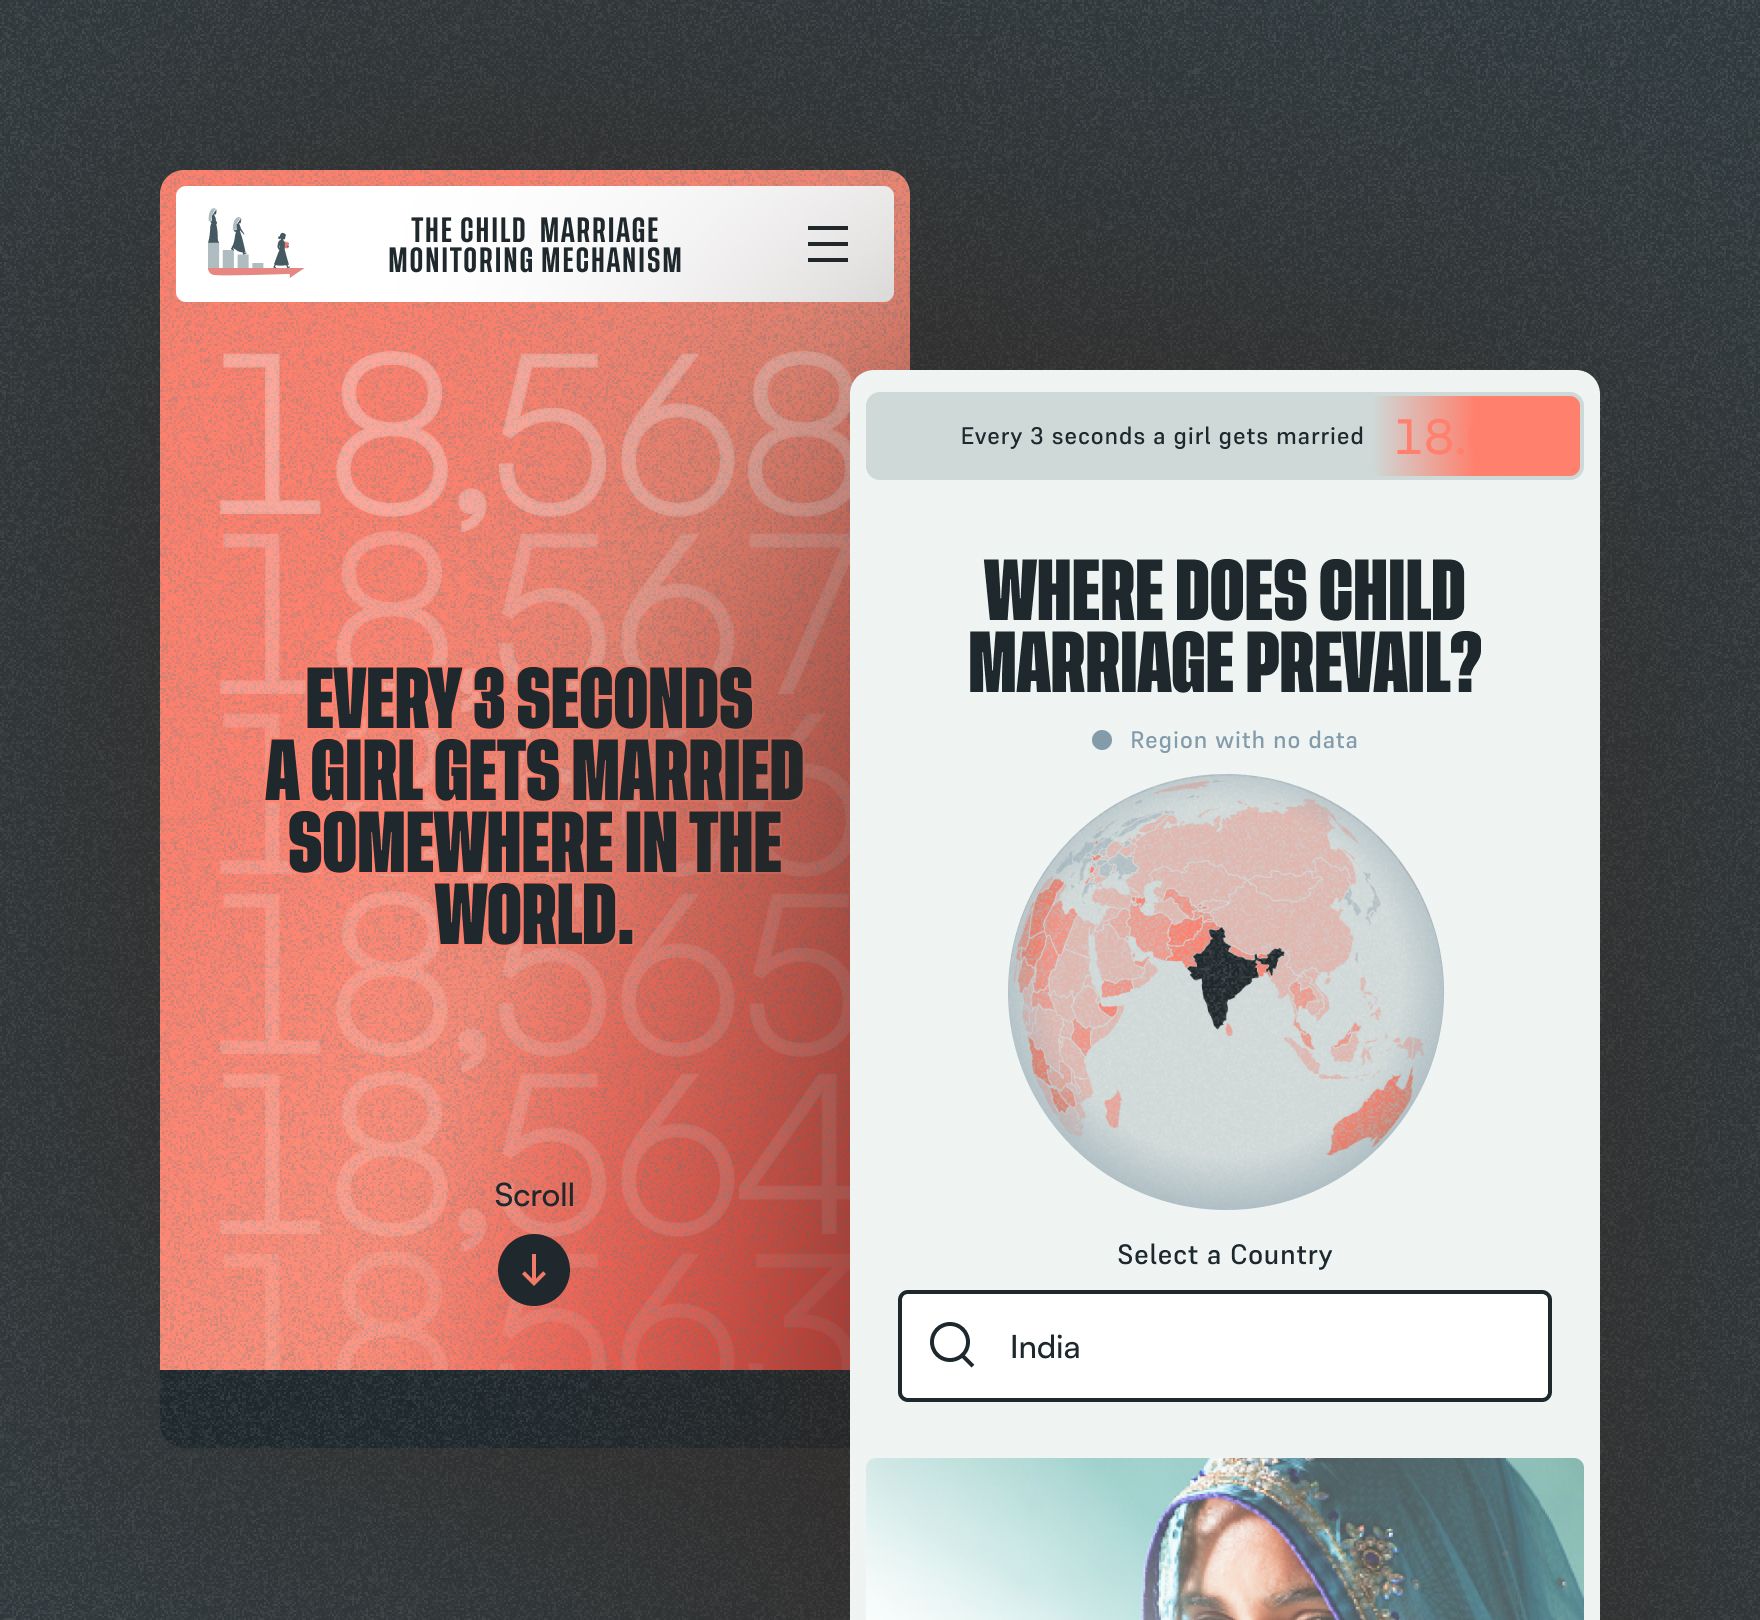
One of the main challenges is to show the scale of the problem. A big counter in the hero moves every time a girl is married, and its animation transmits that pulse to the visitor, creating a sense of urgency. A small widget with the same counter follows on every page, so the pulse never leaves.
The story inside each country
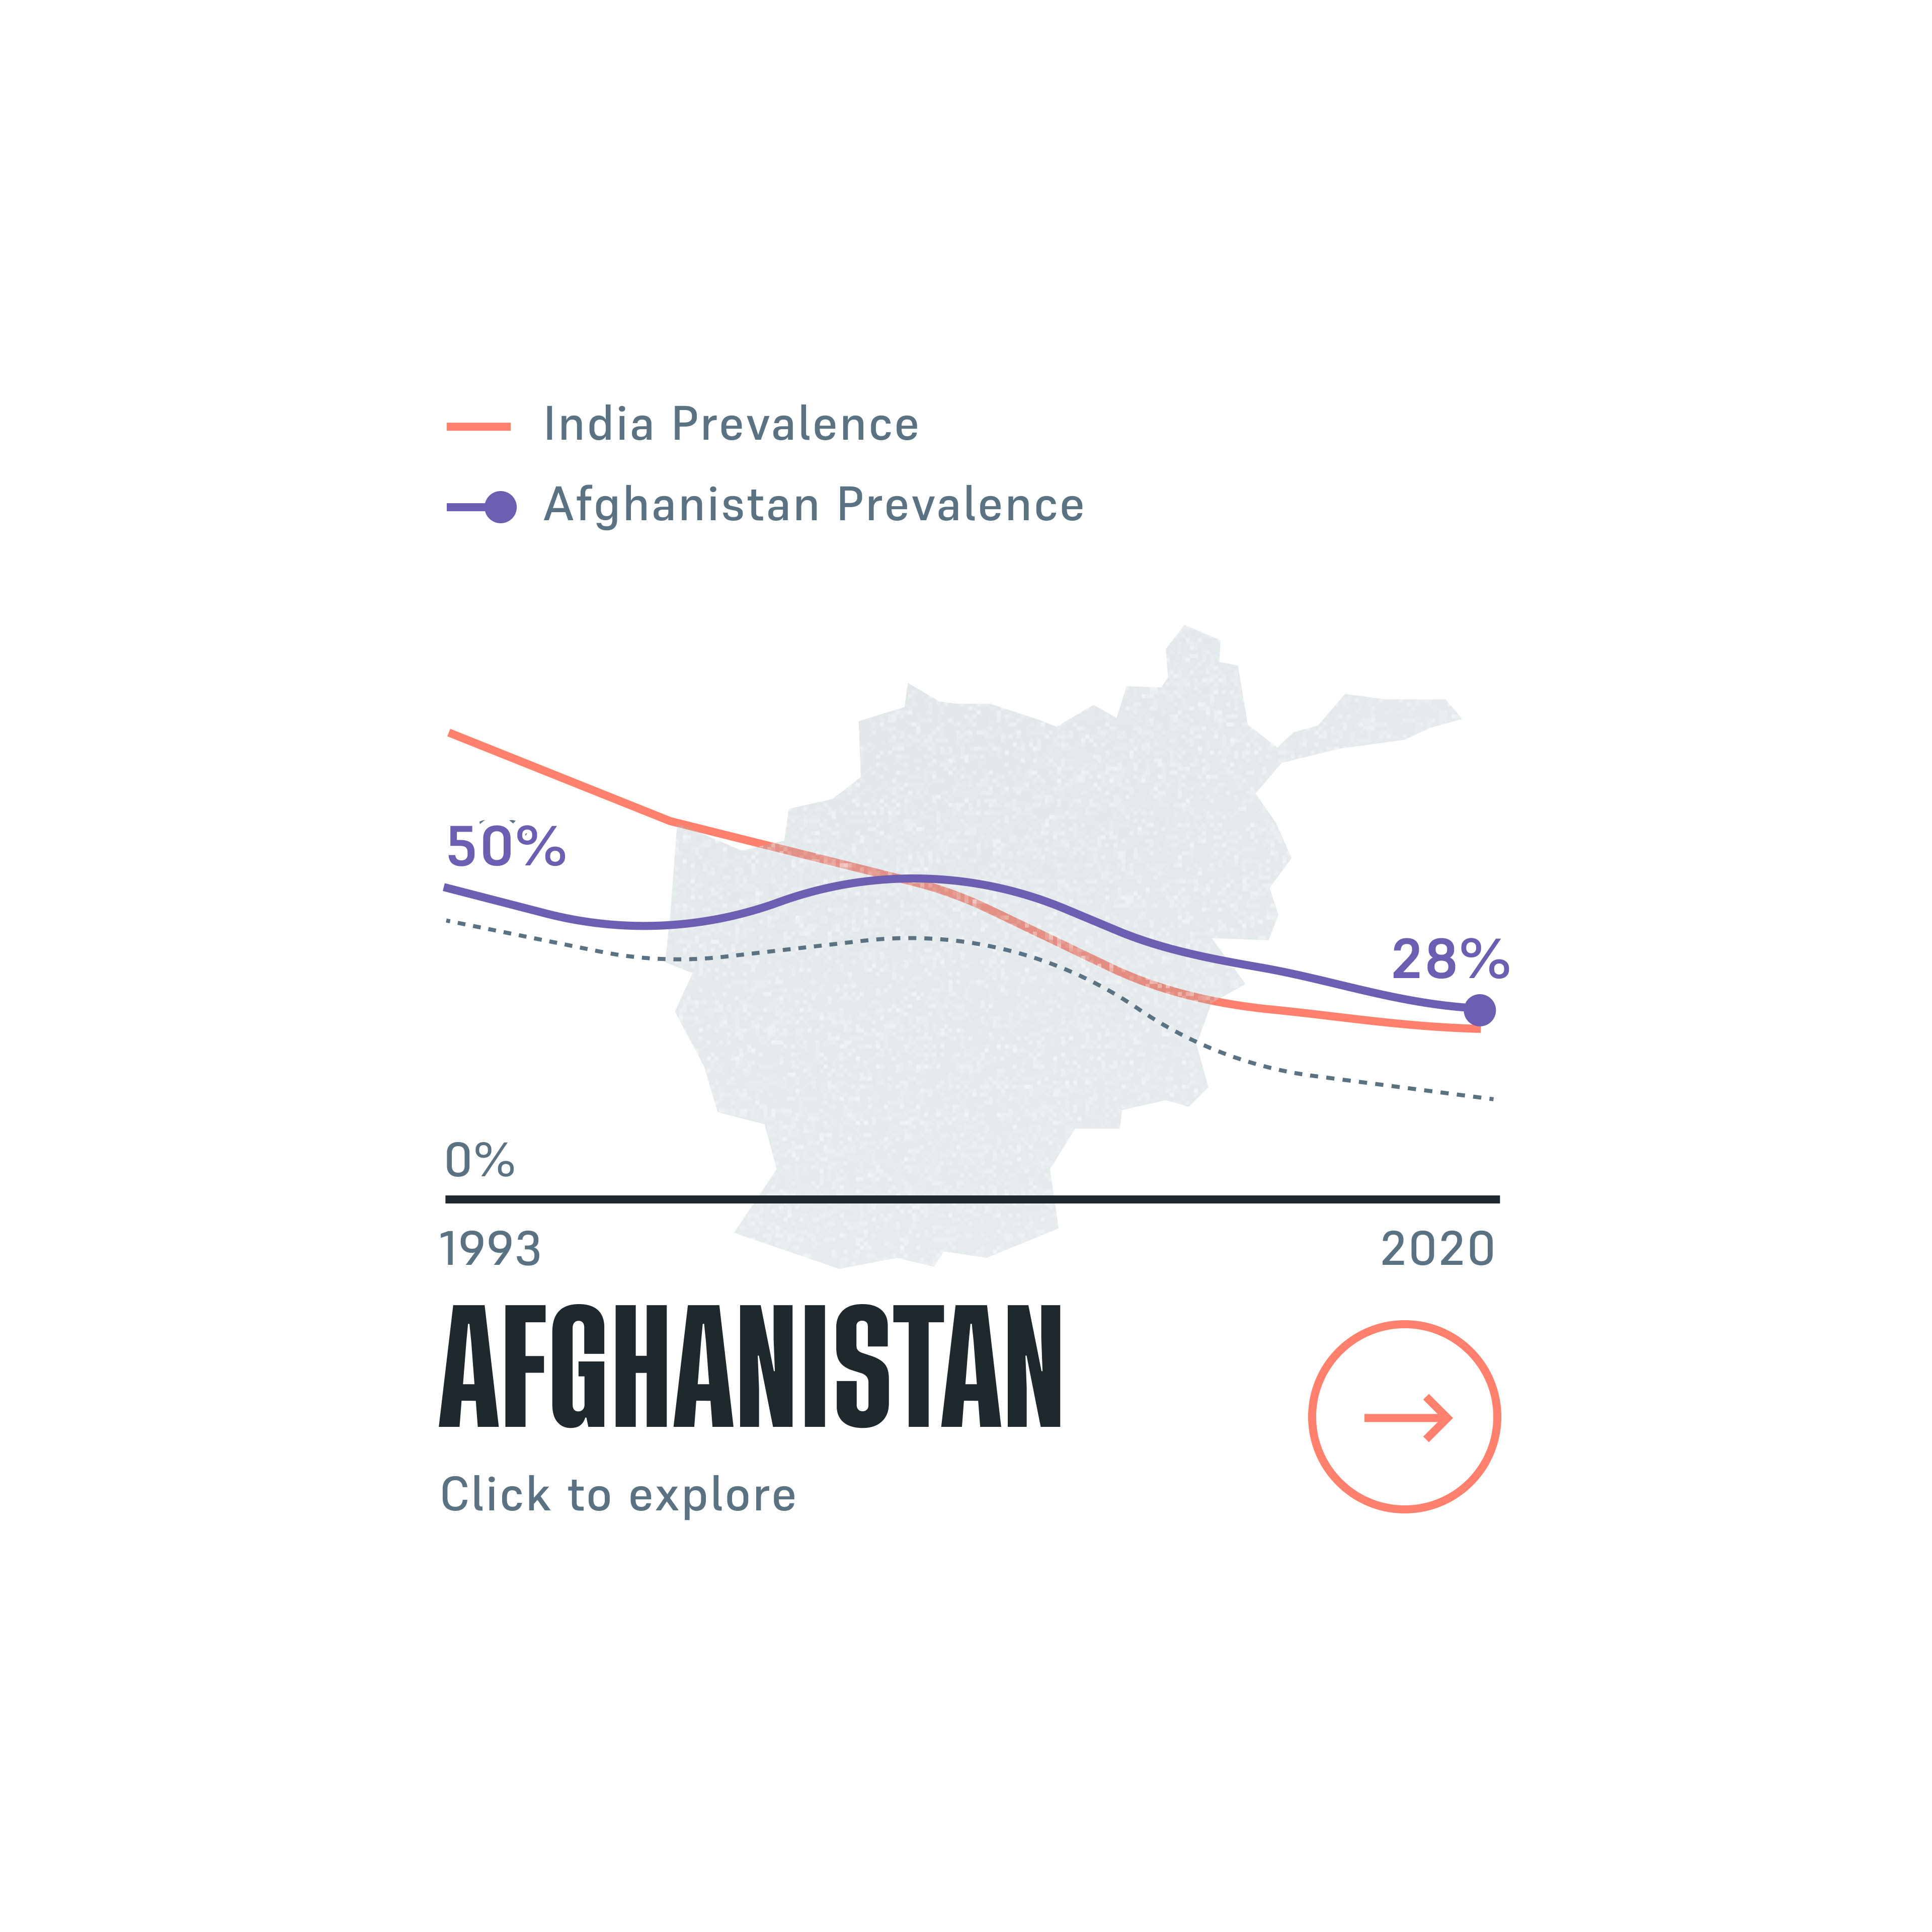
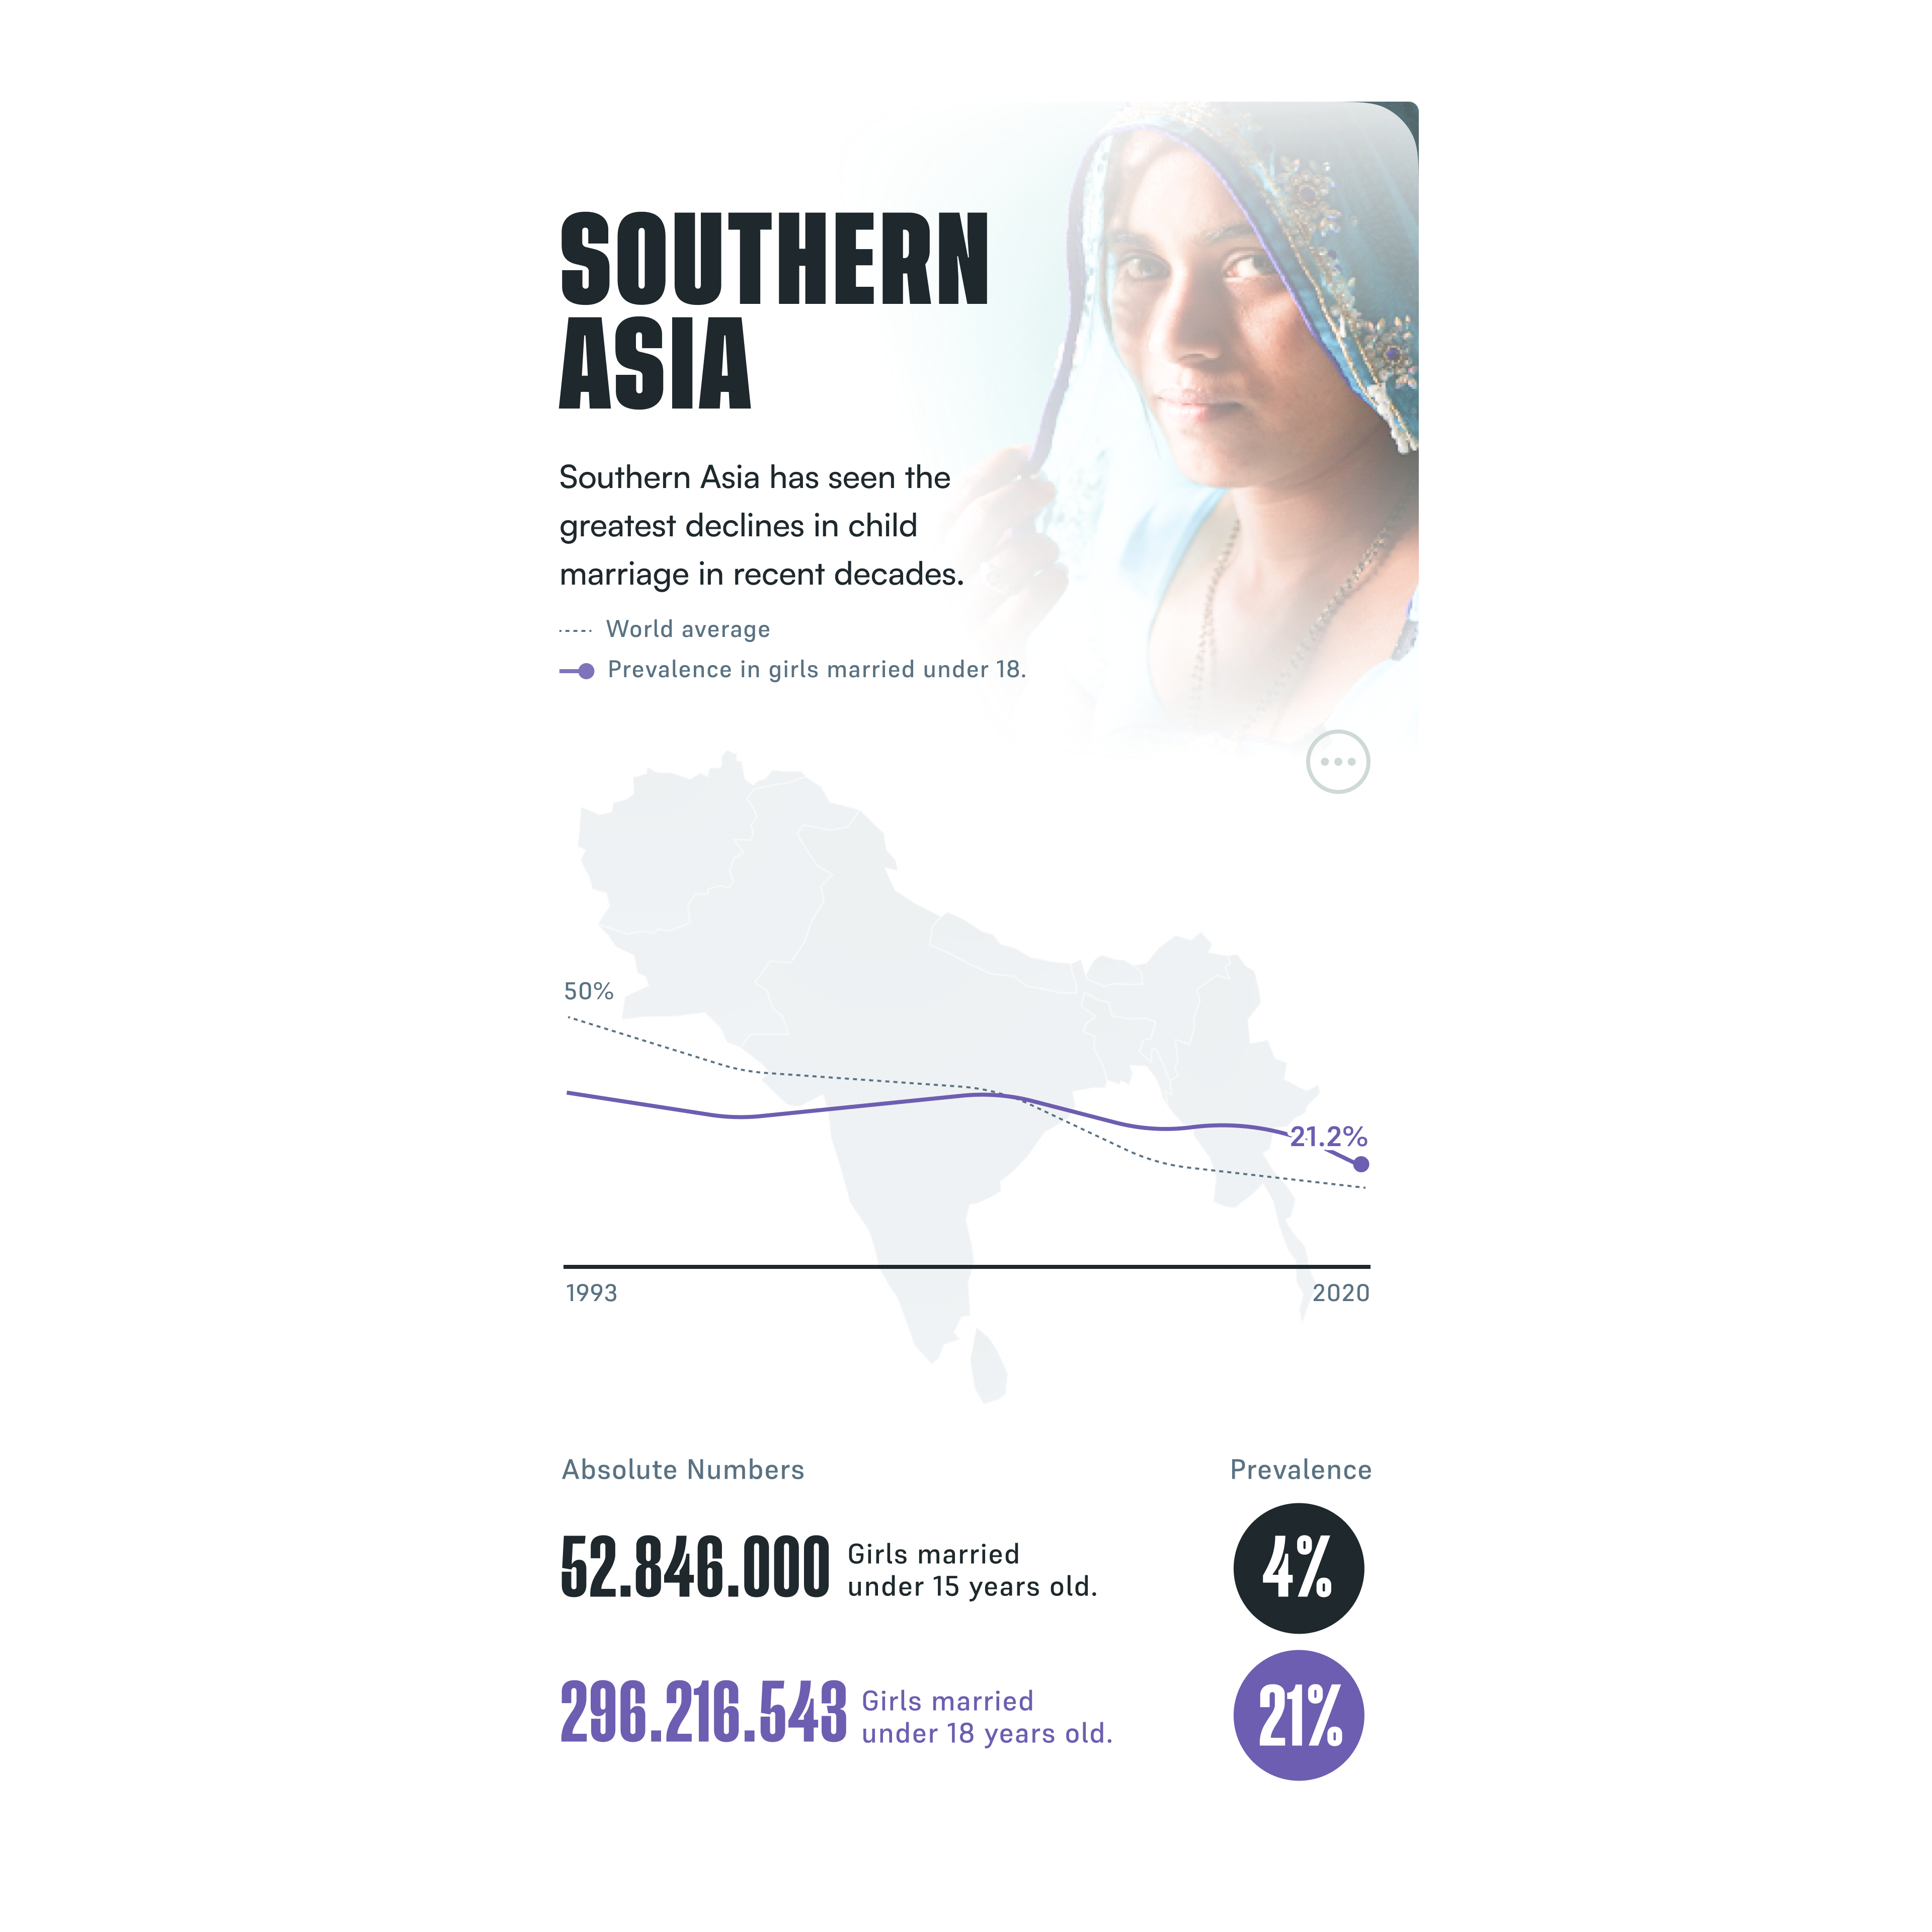
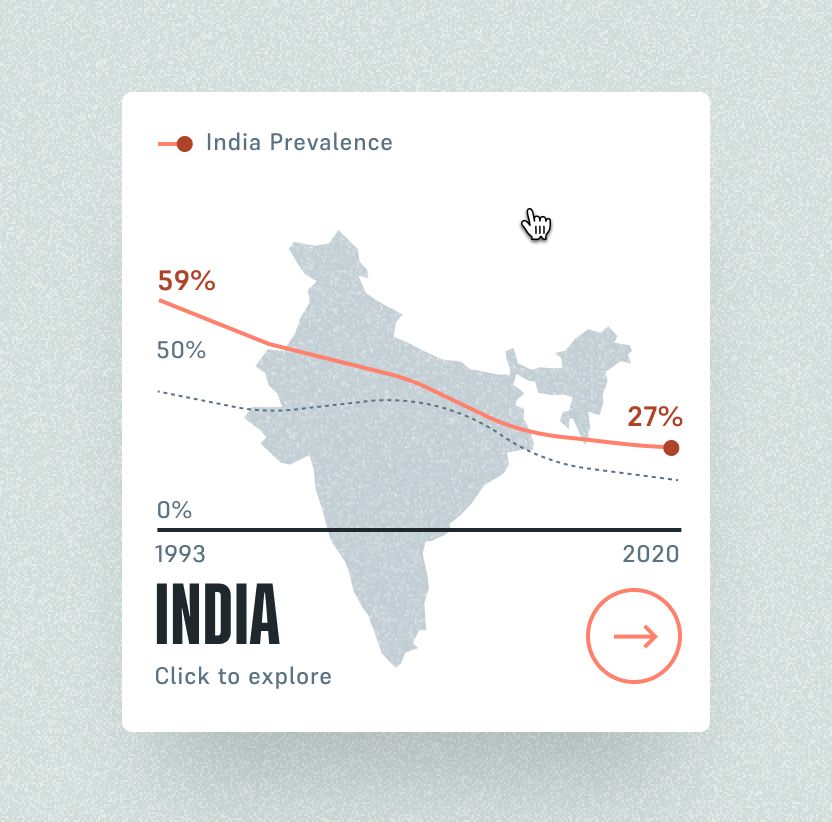
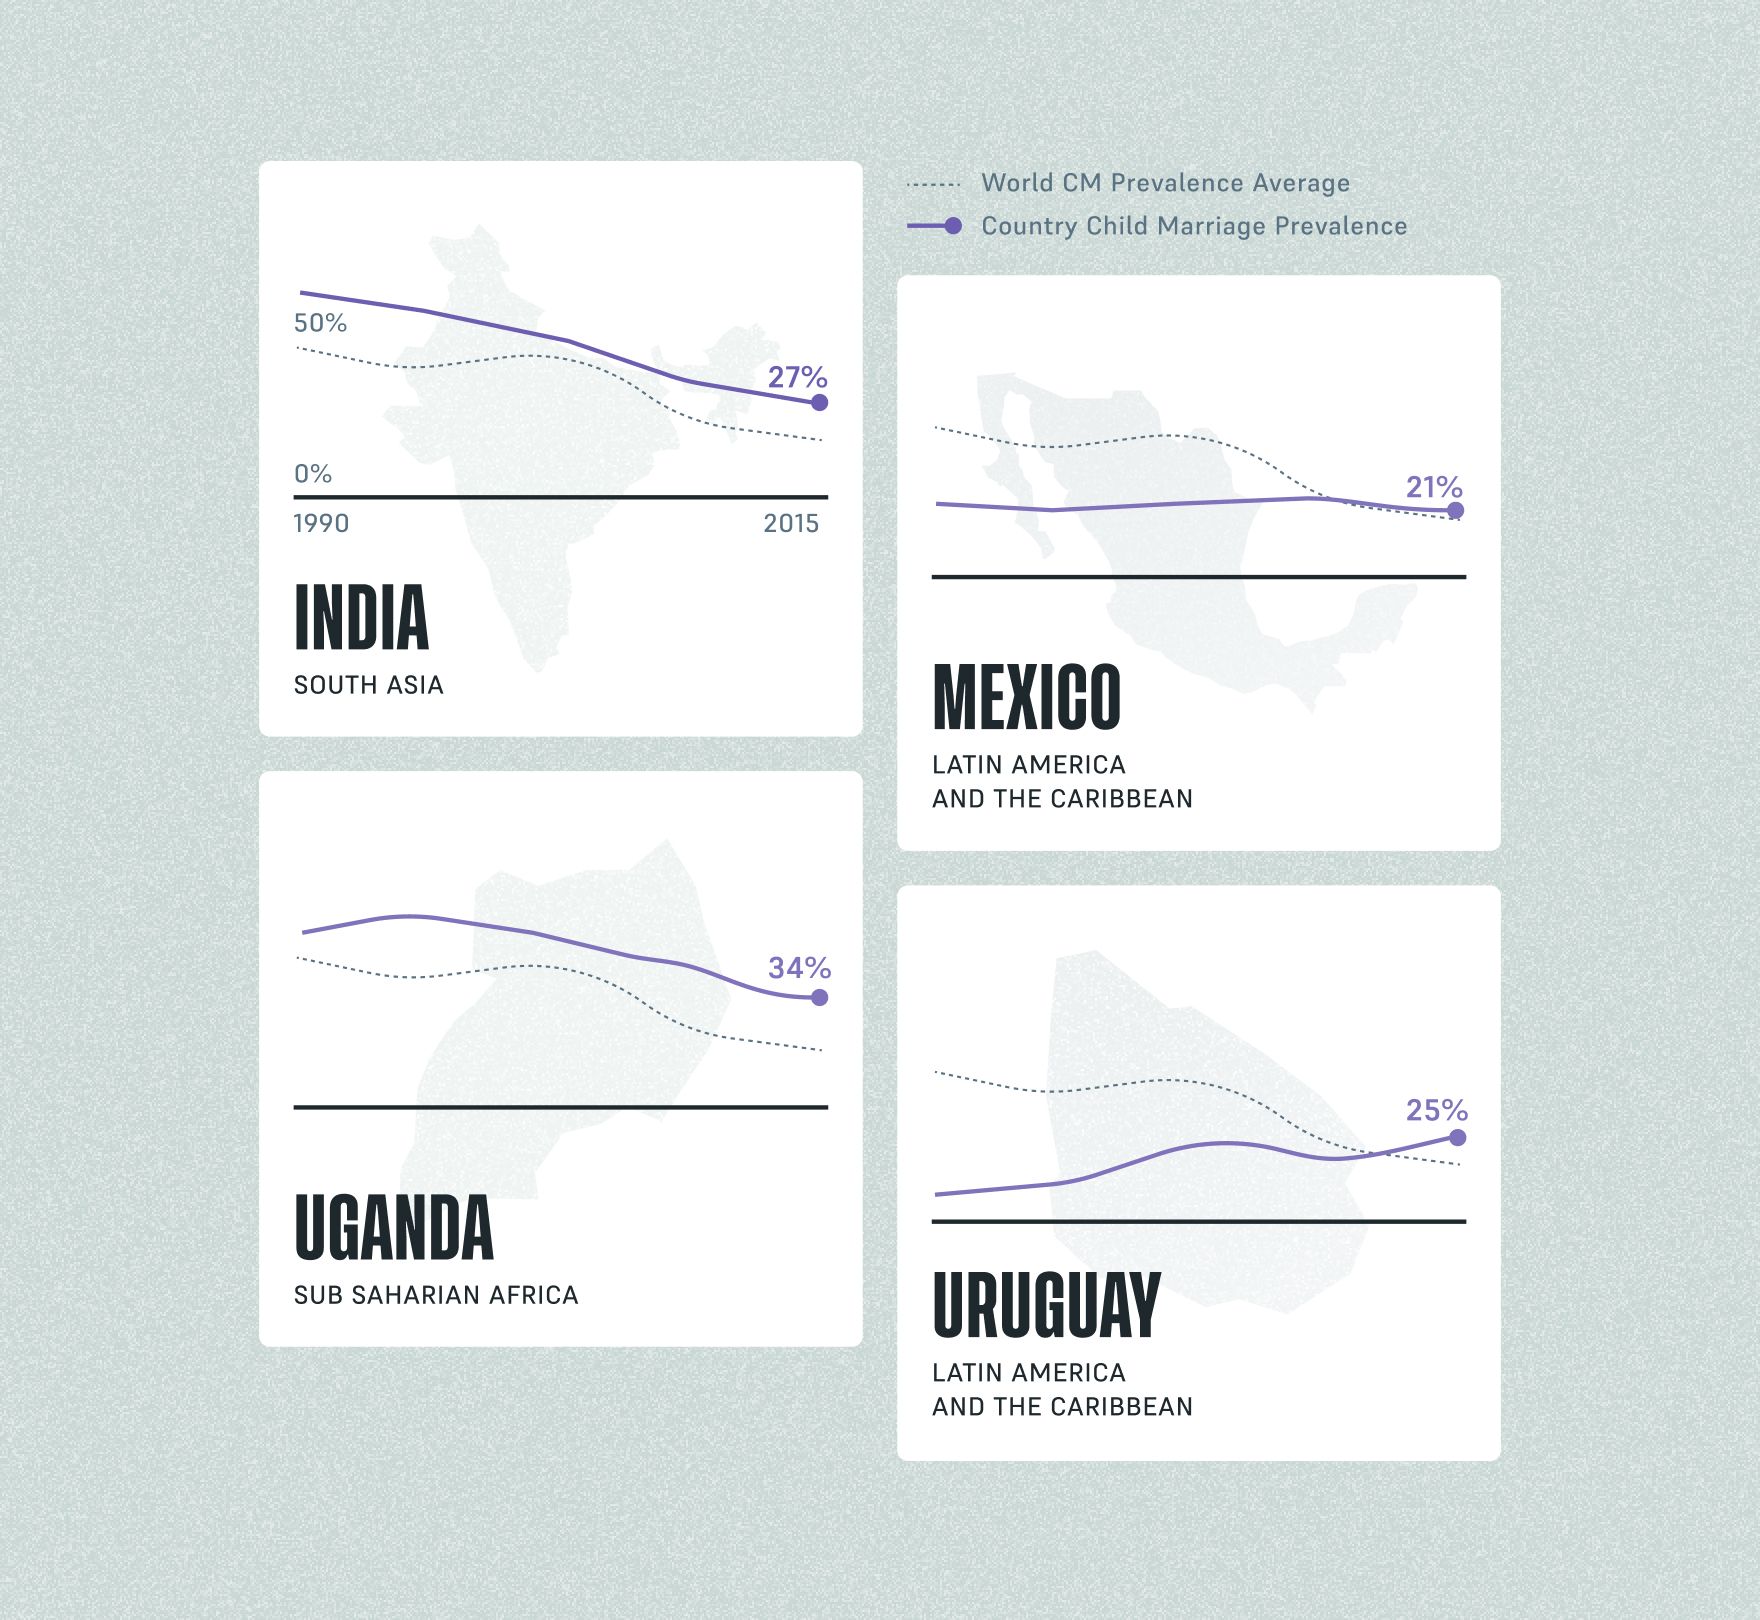
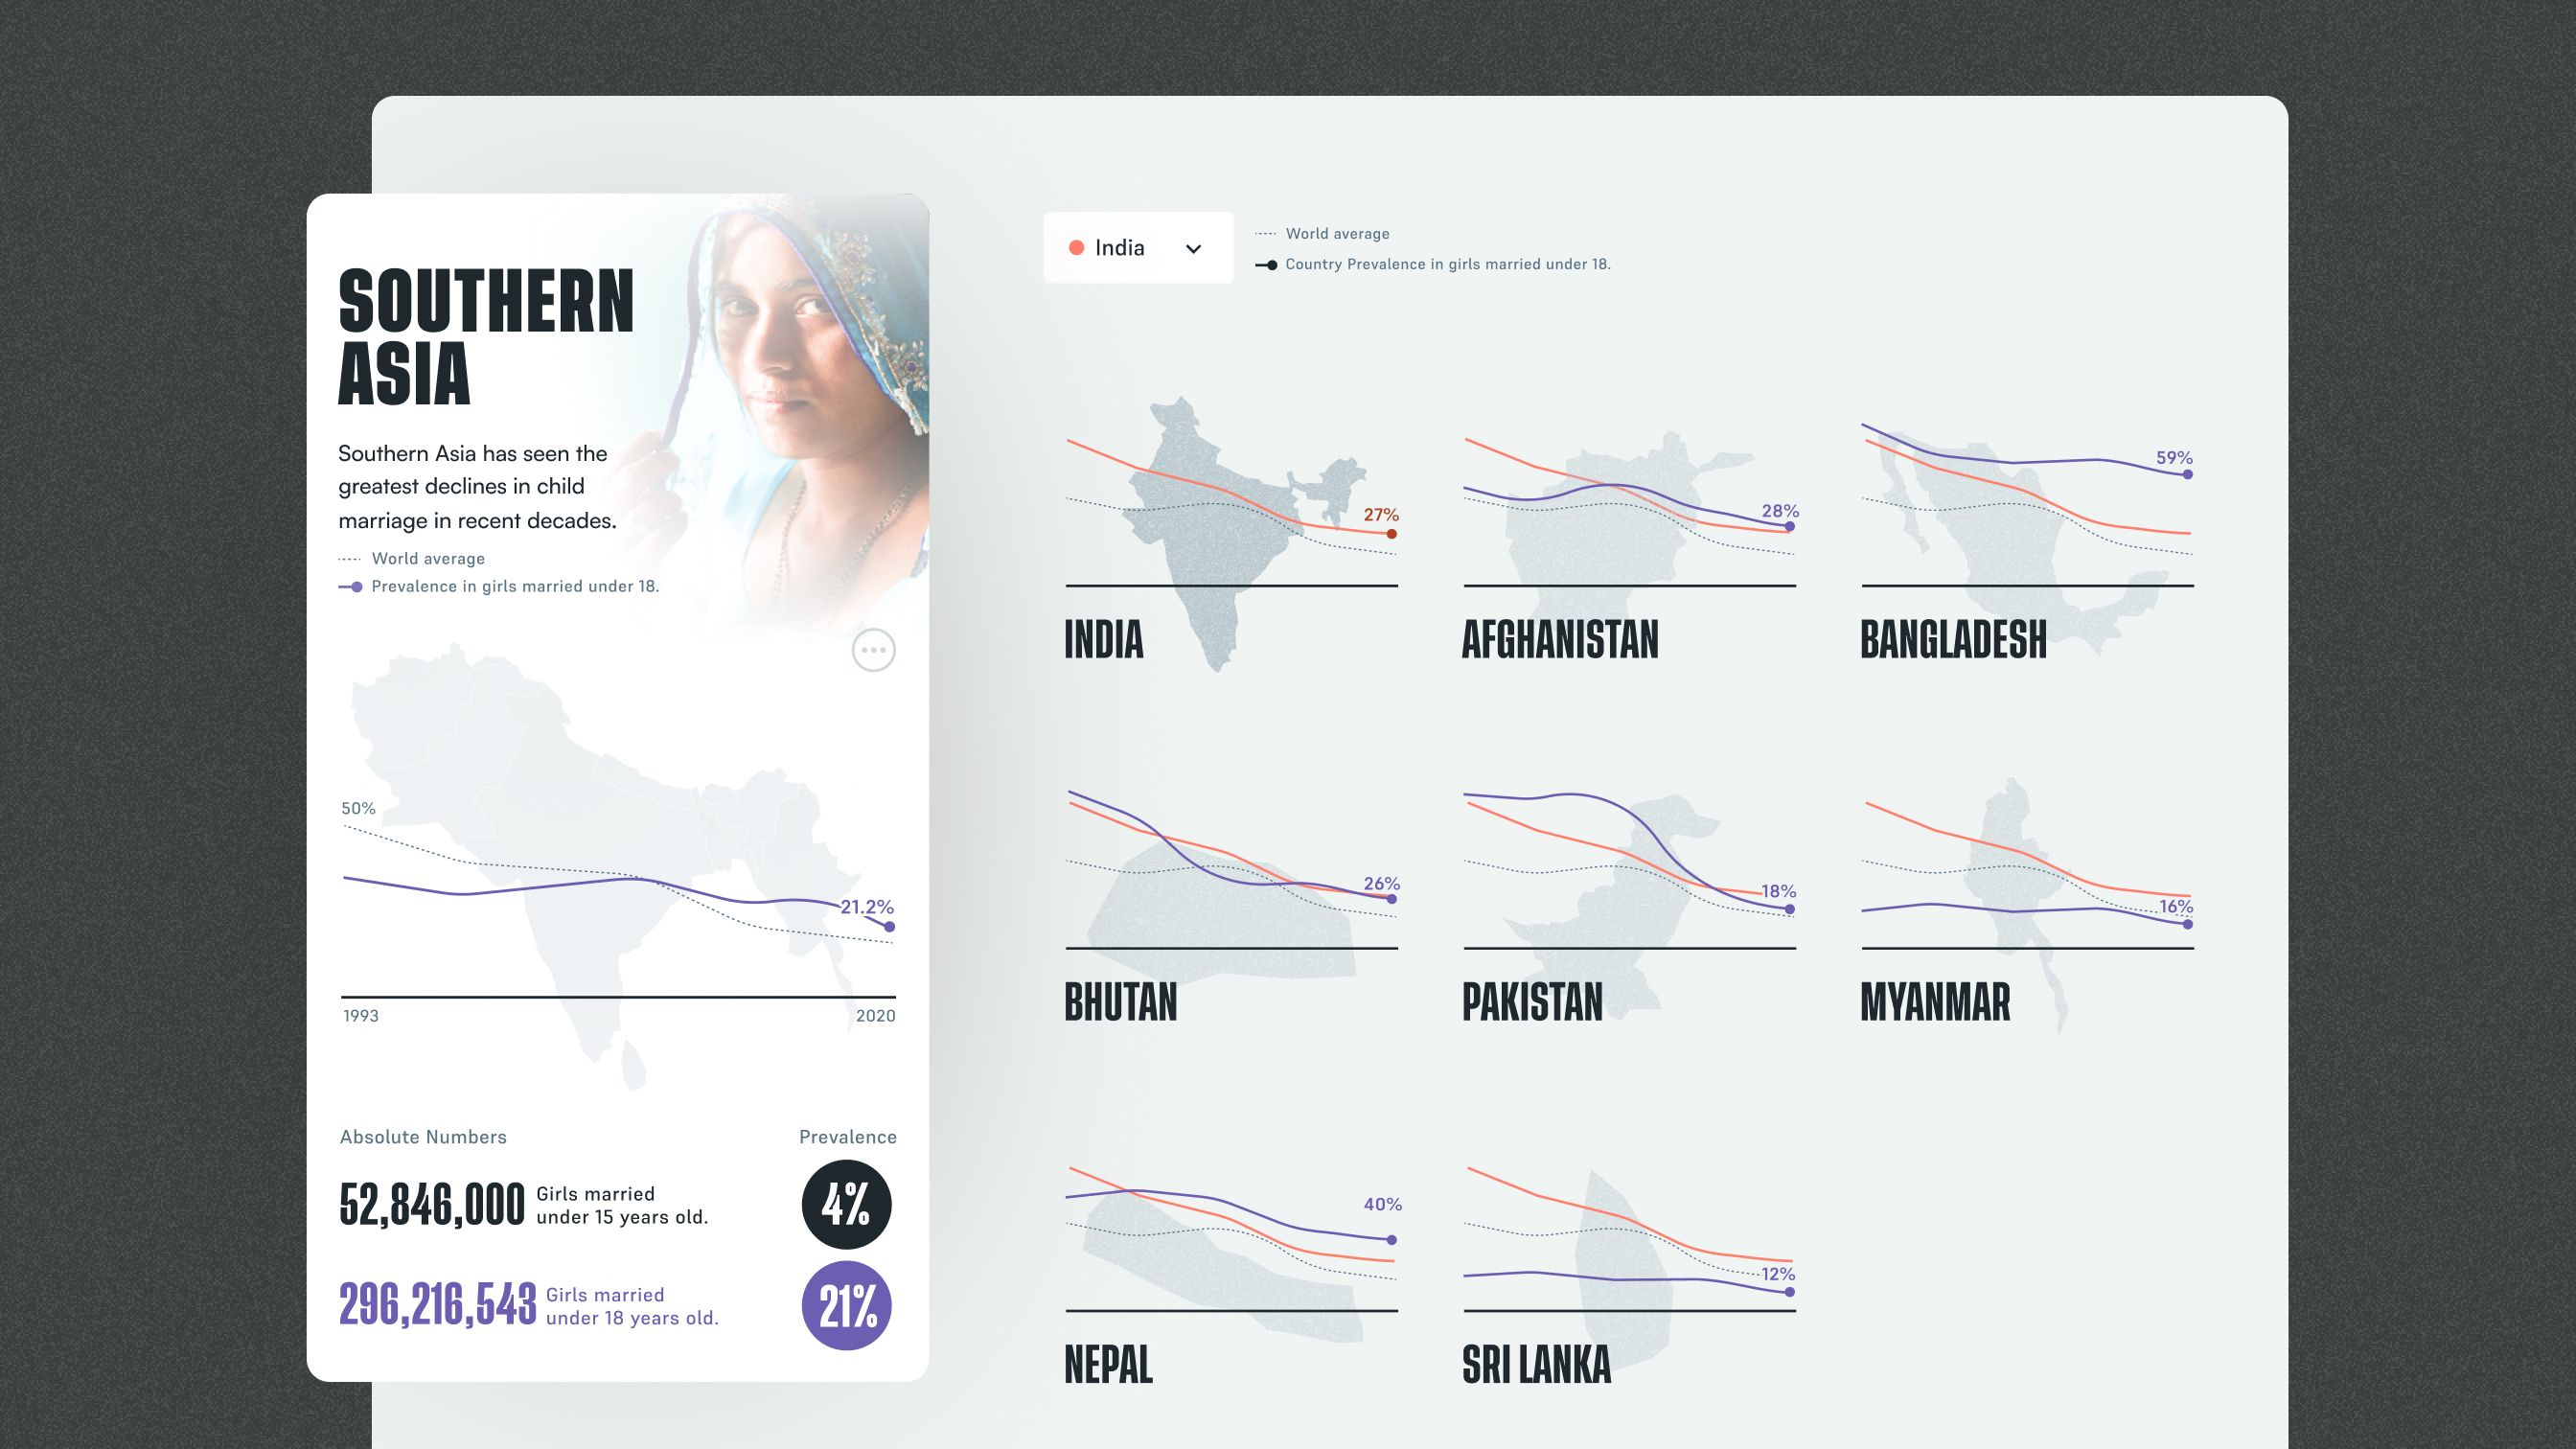
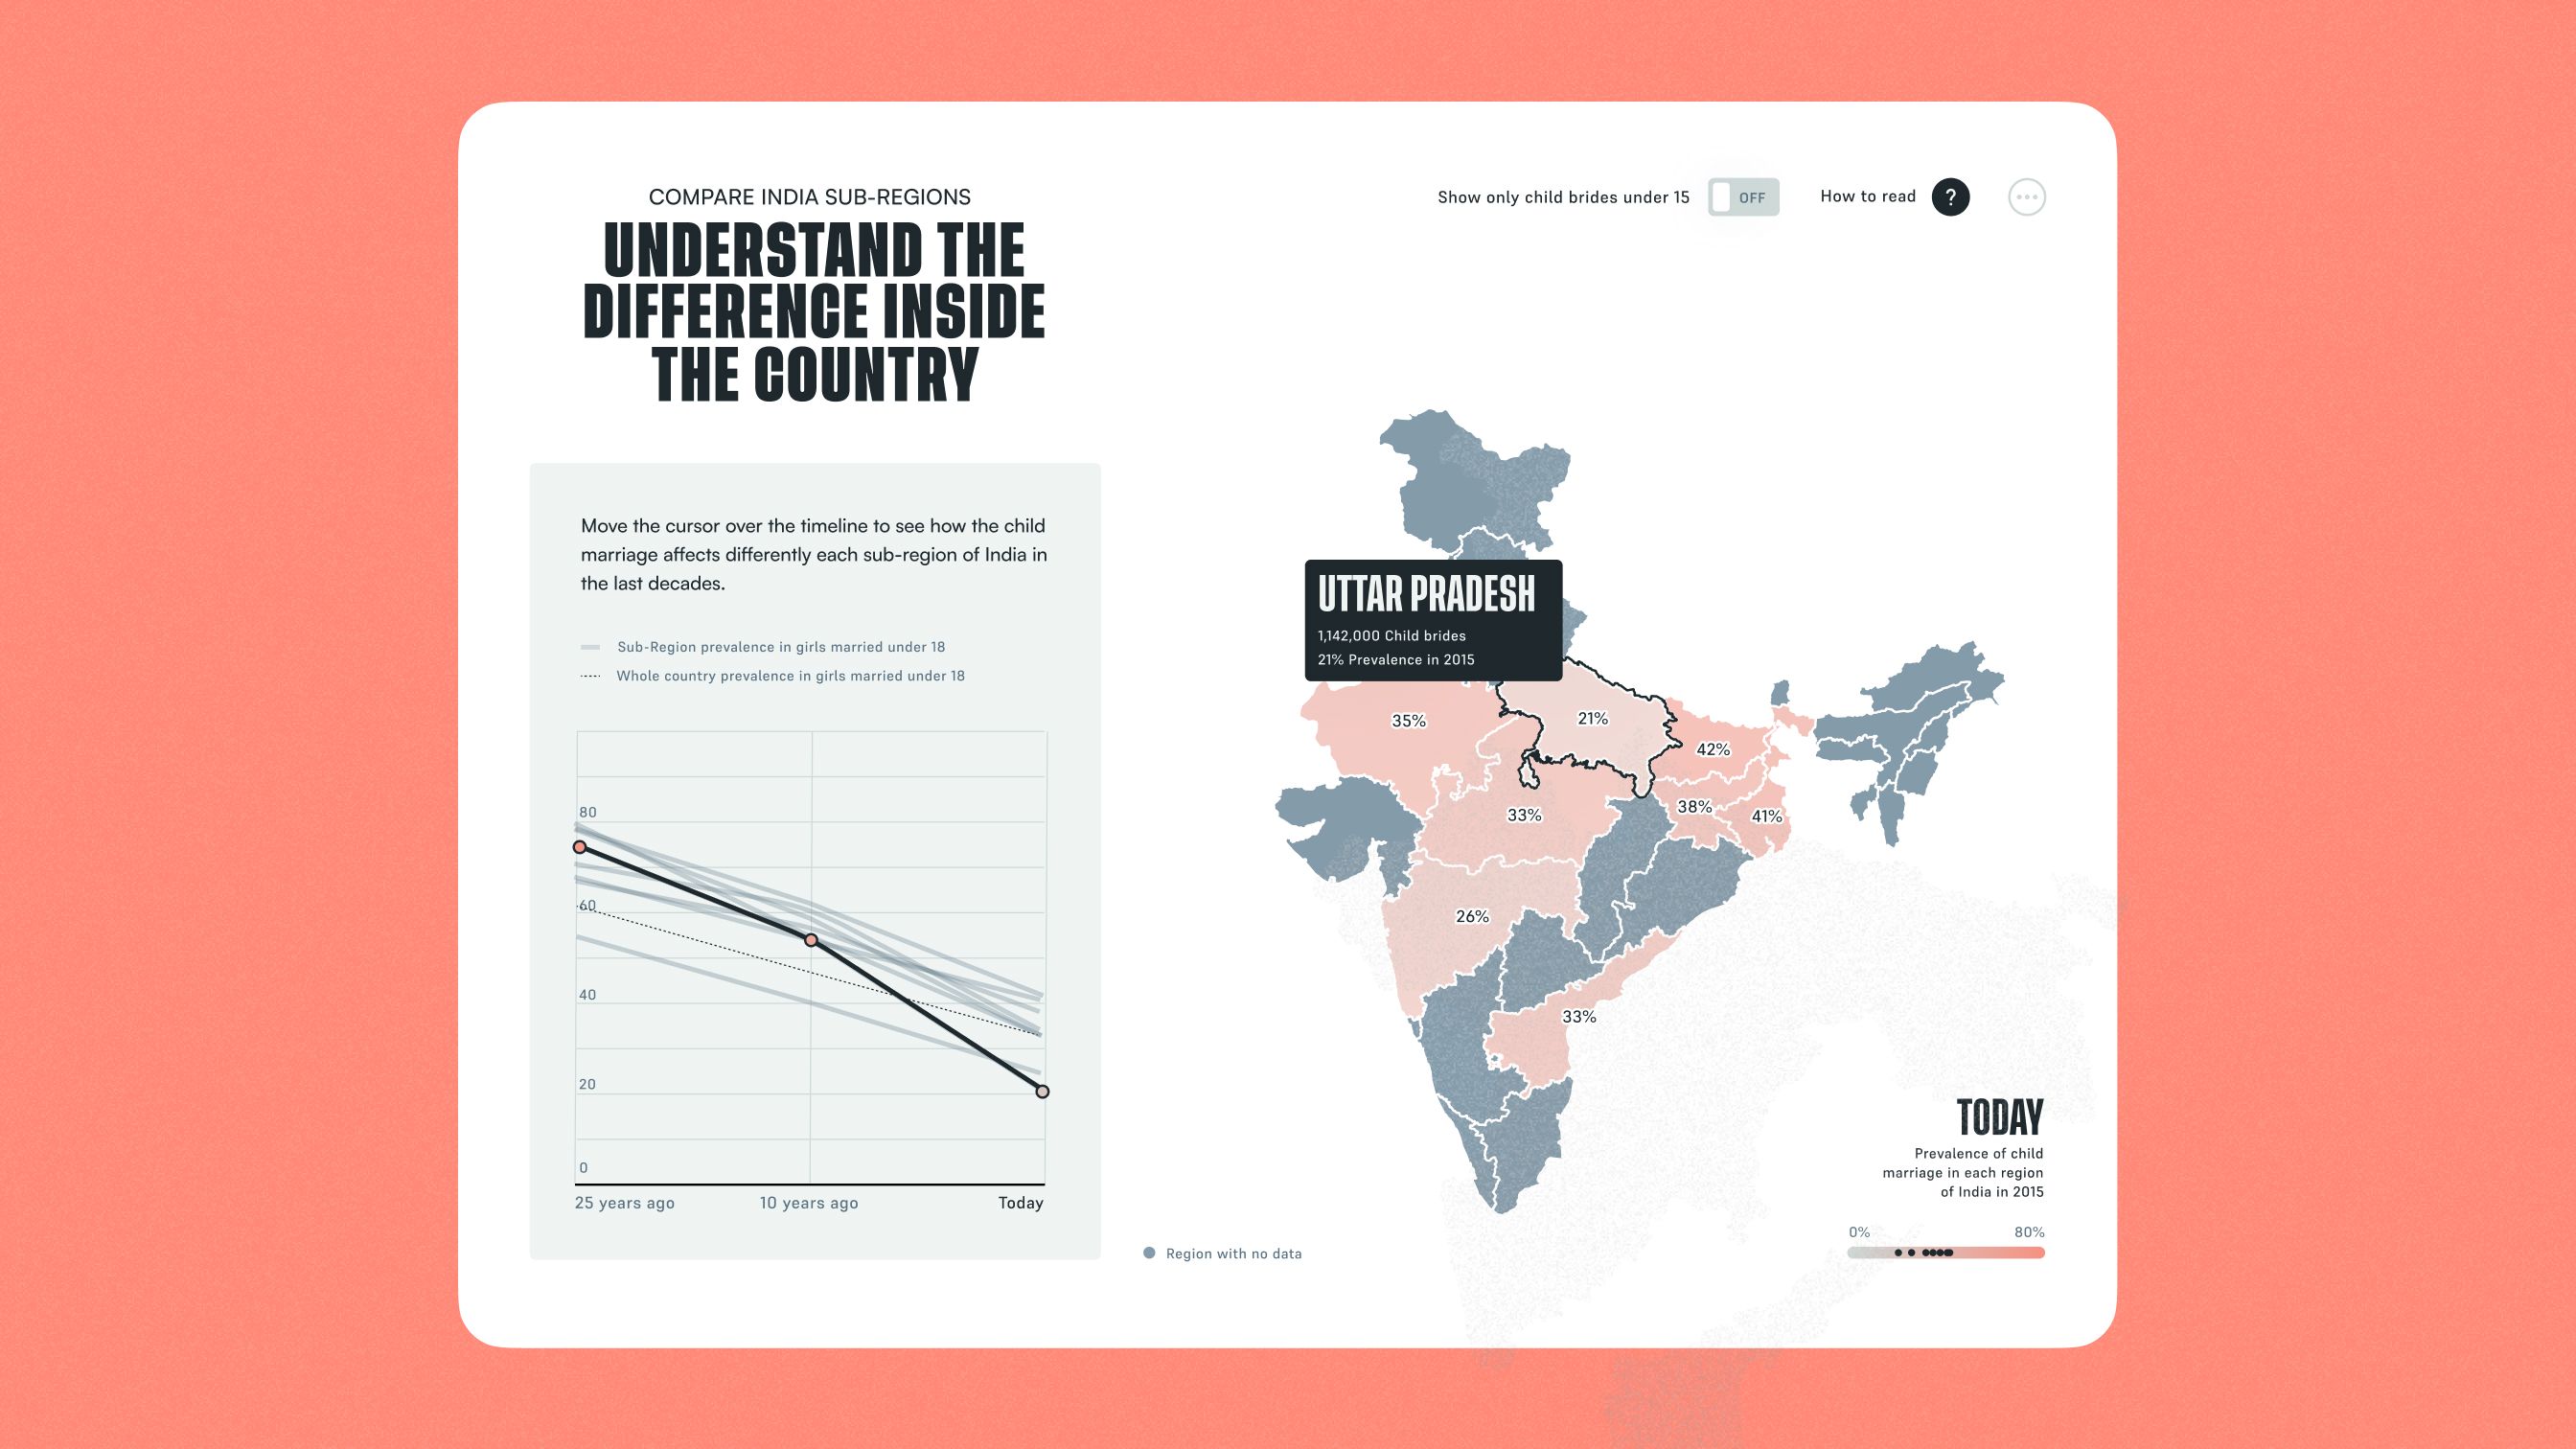
Going deeper by country could have meant a different chart for every question. Instead, the profiles keep one visual language: a silhouette of the country, a trend line and a dotted line for the average to measure it against. The same language carries from a region to its countries and from a country to its sub-regions, so each step adds depth without a new way to read. Tools like comparing countries or moving through a timeline invite people to explore, and a "how to read" guide backs the more complex charts.
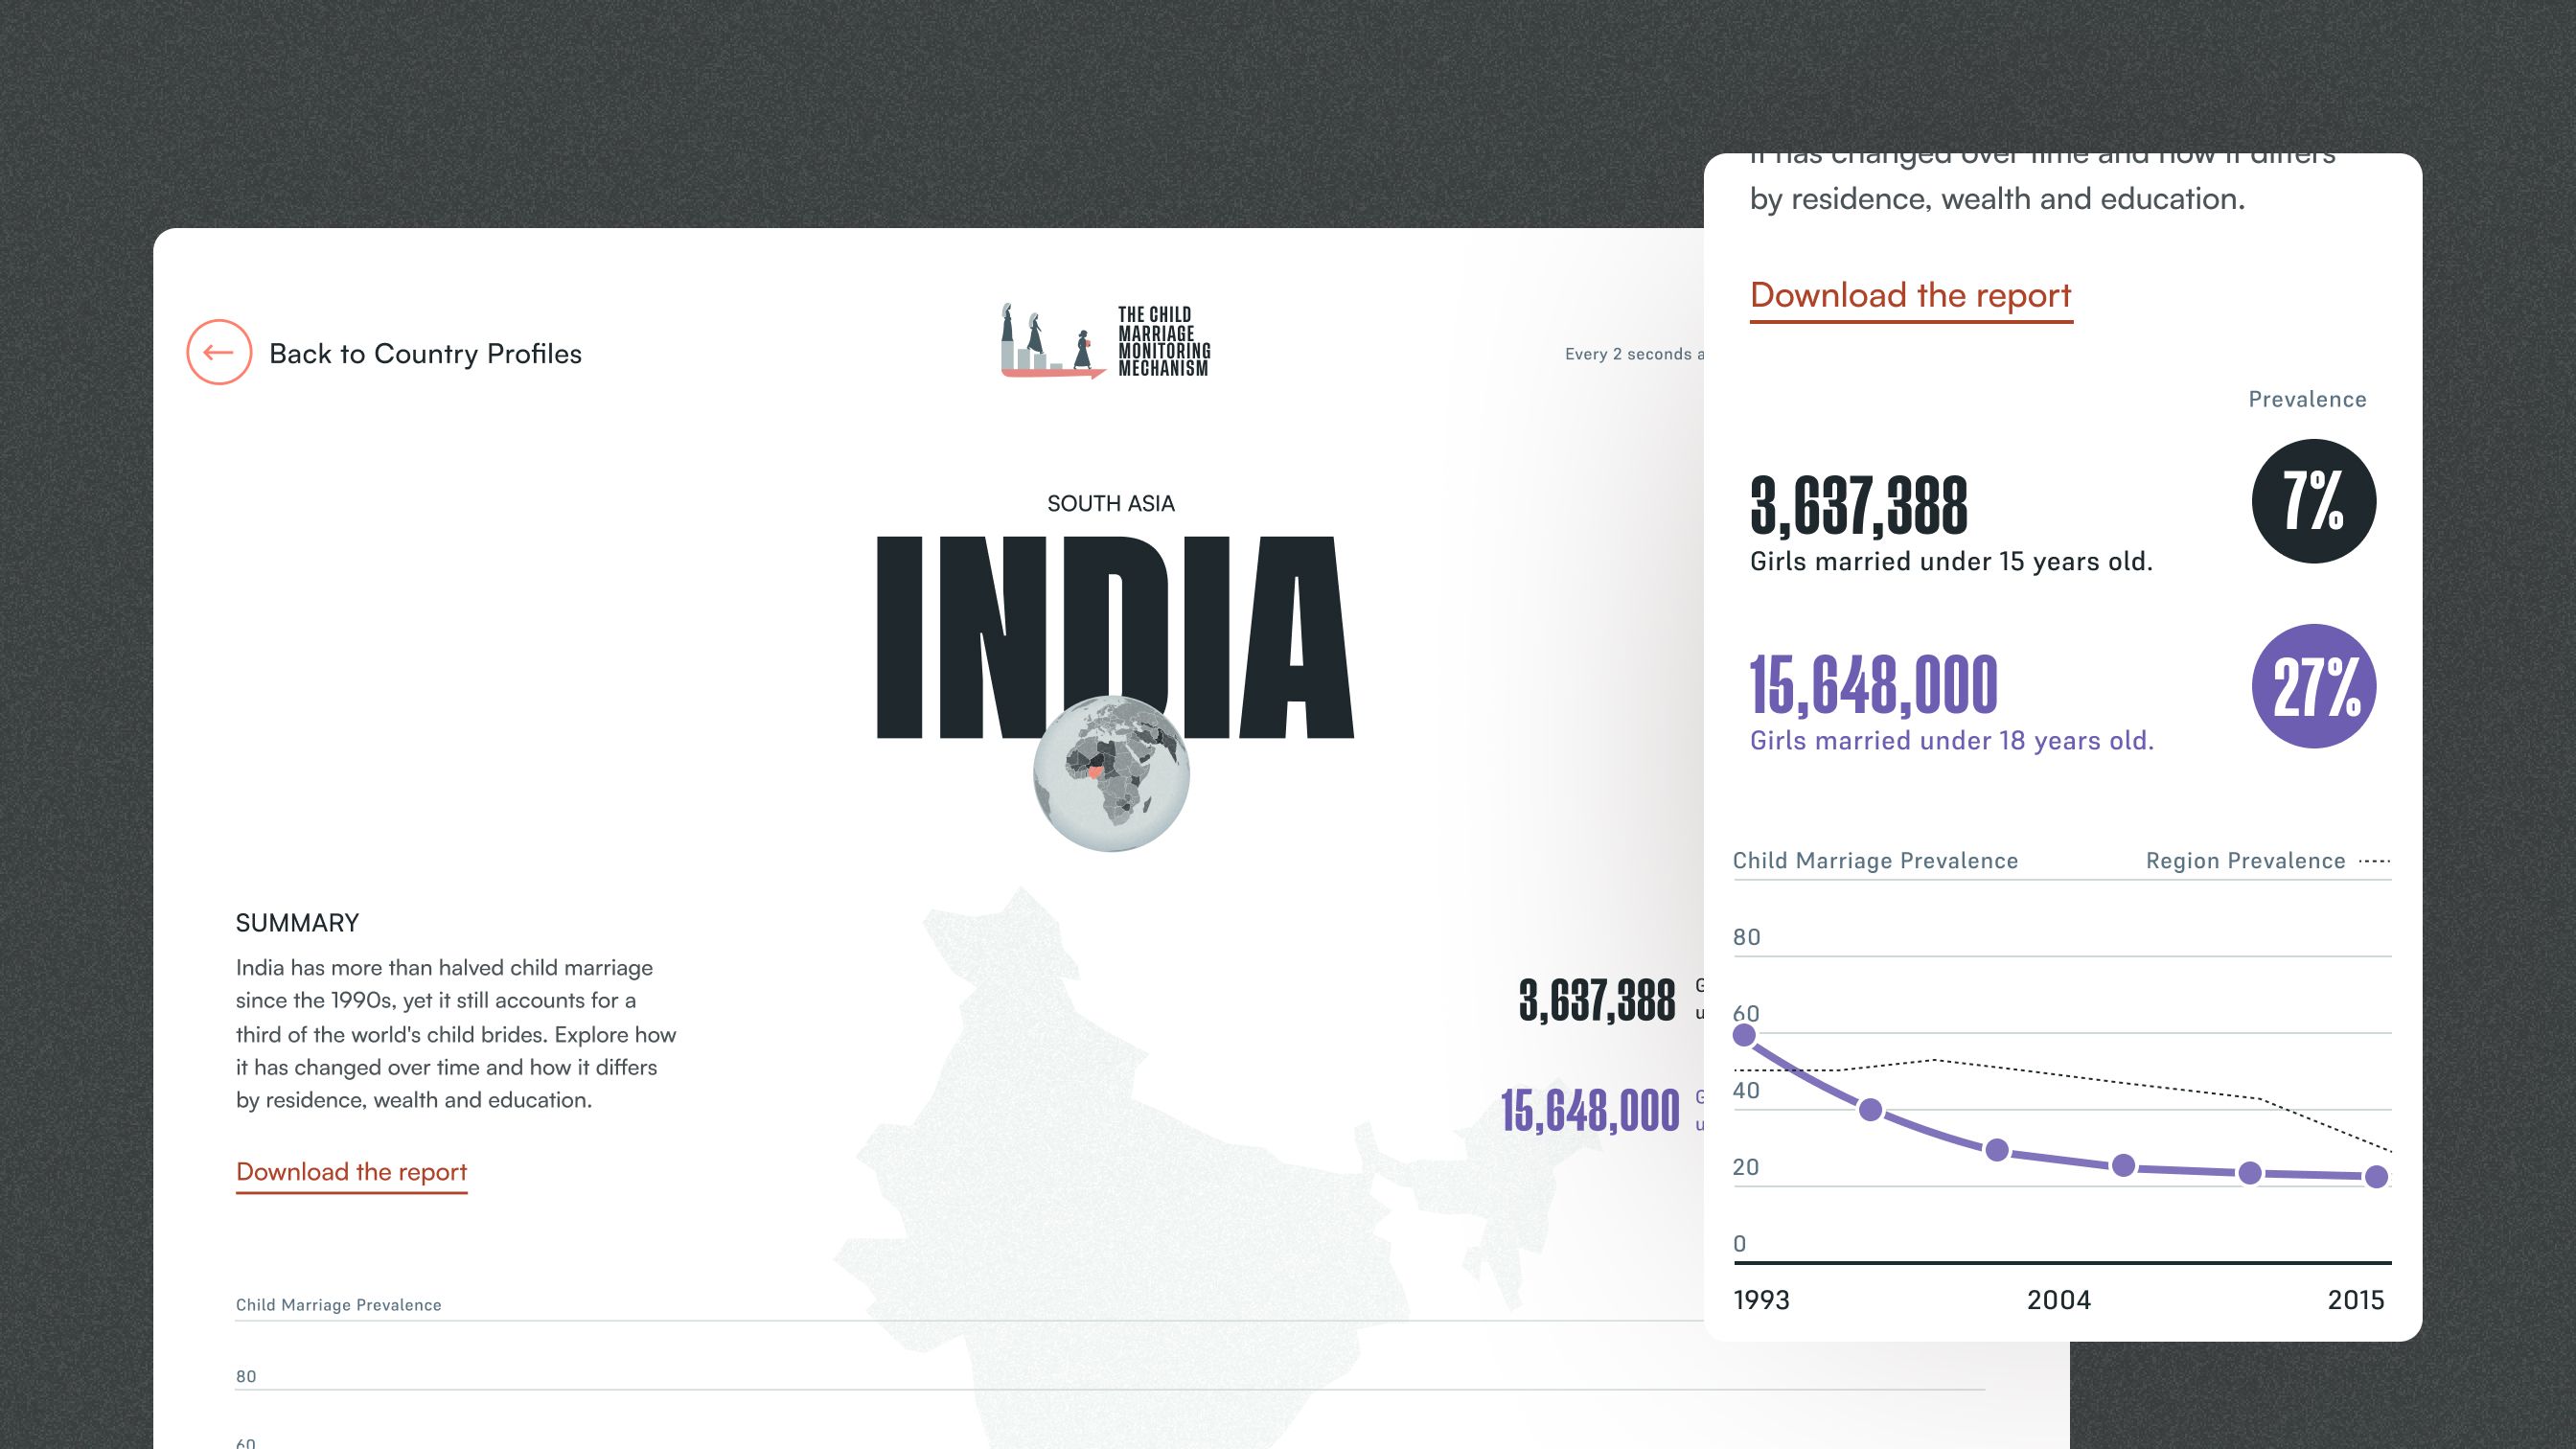
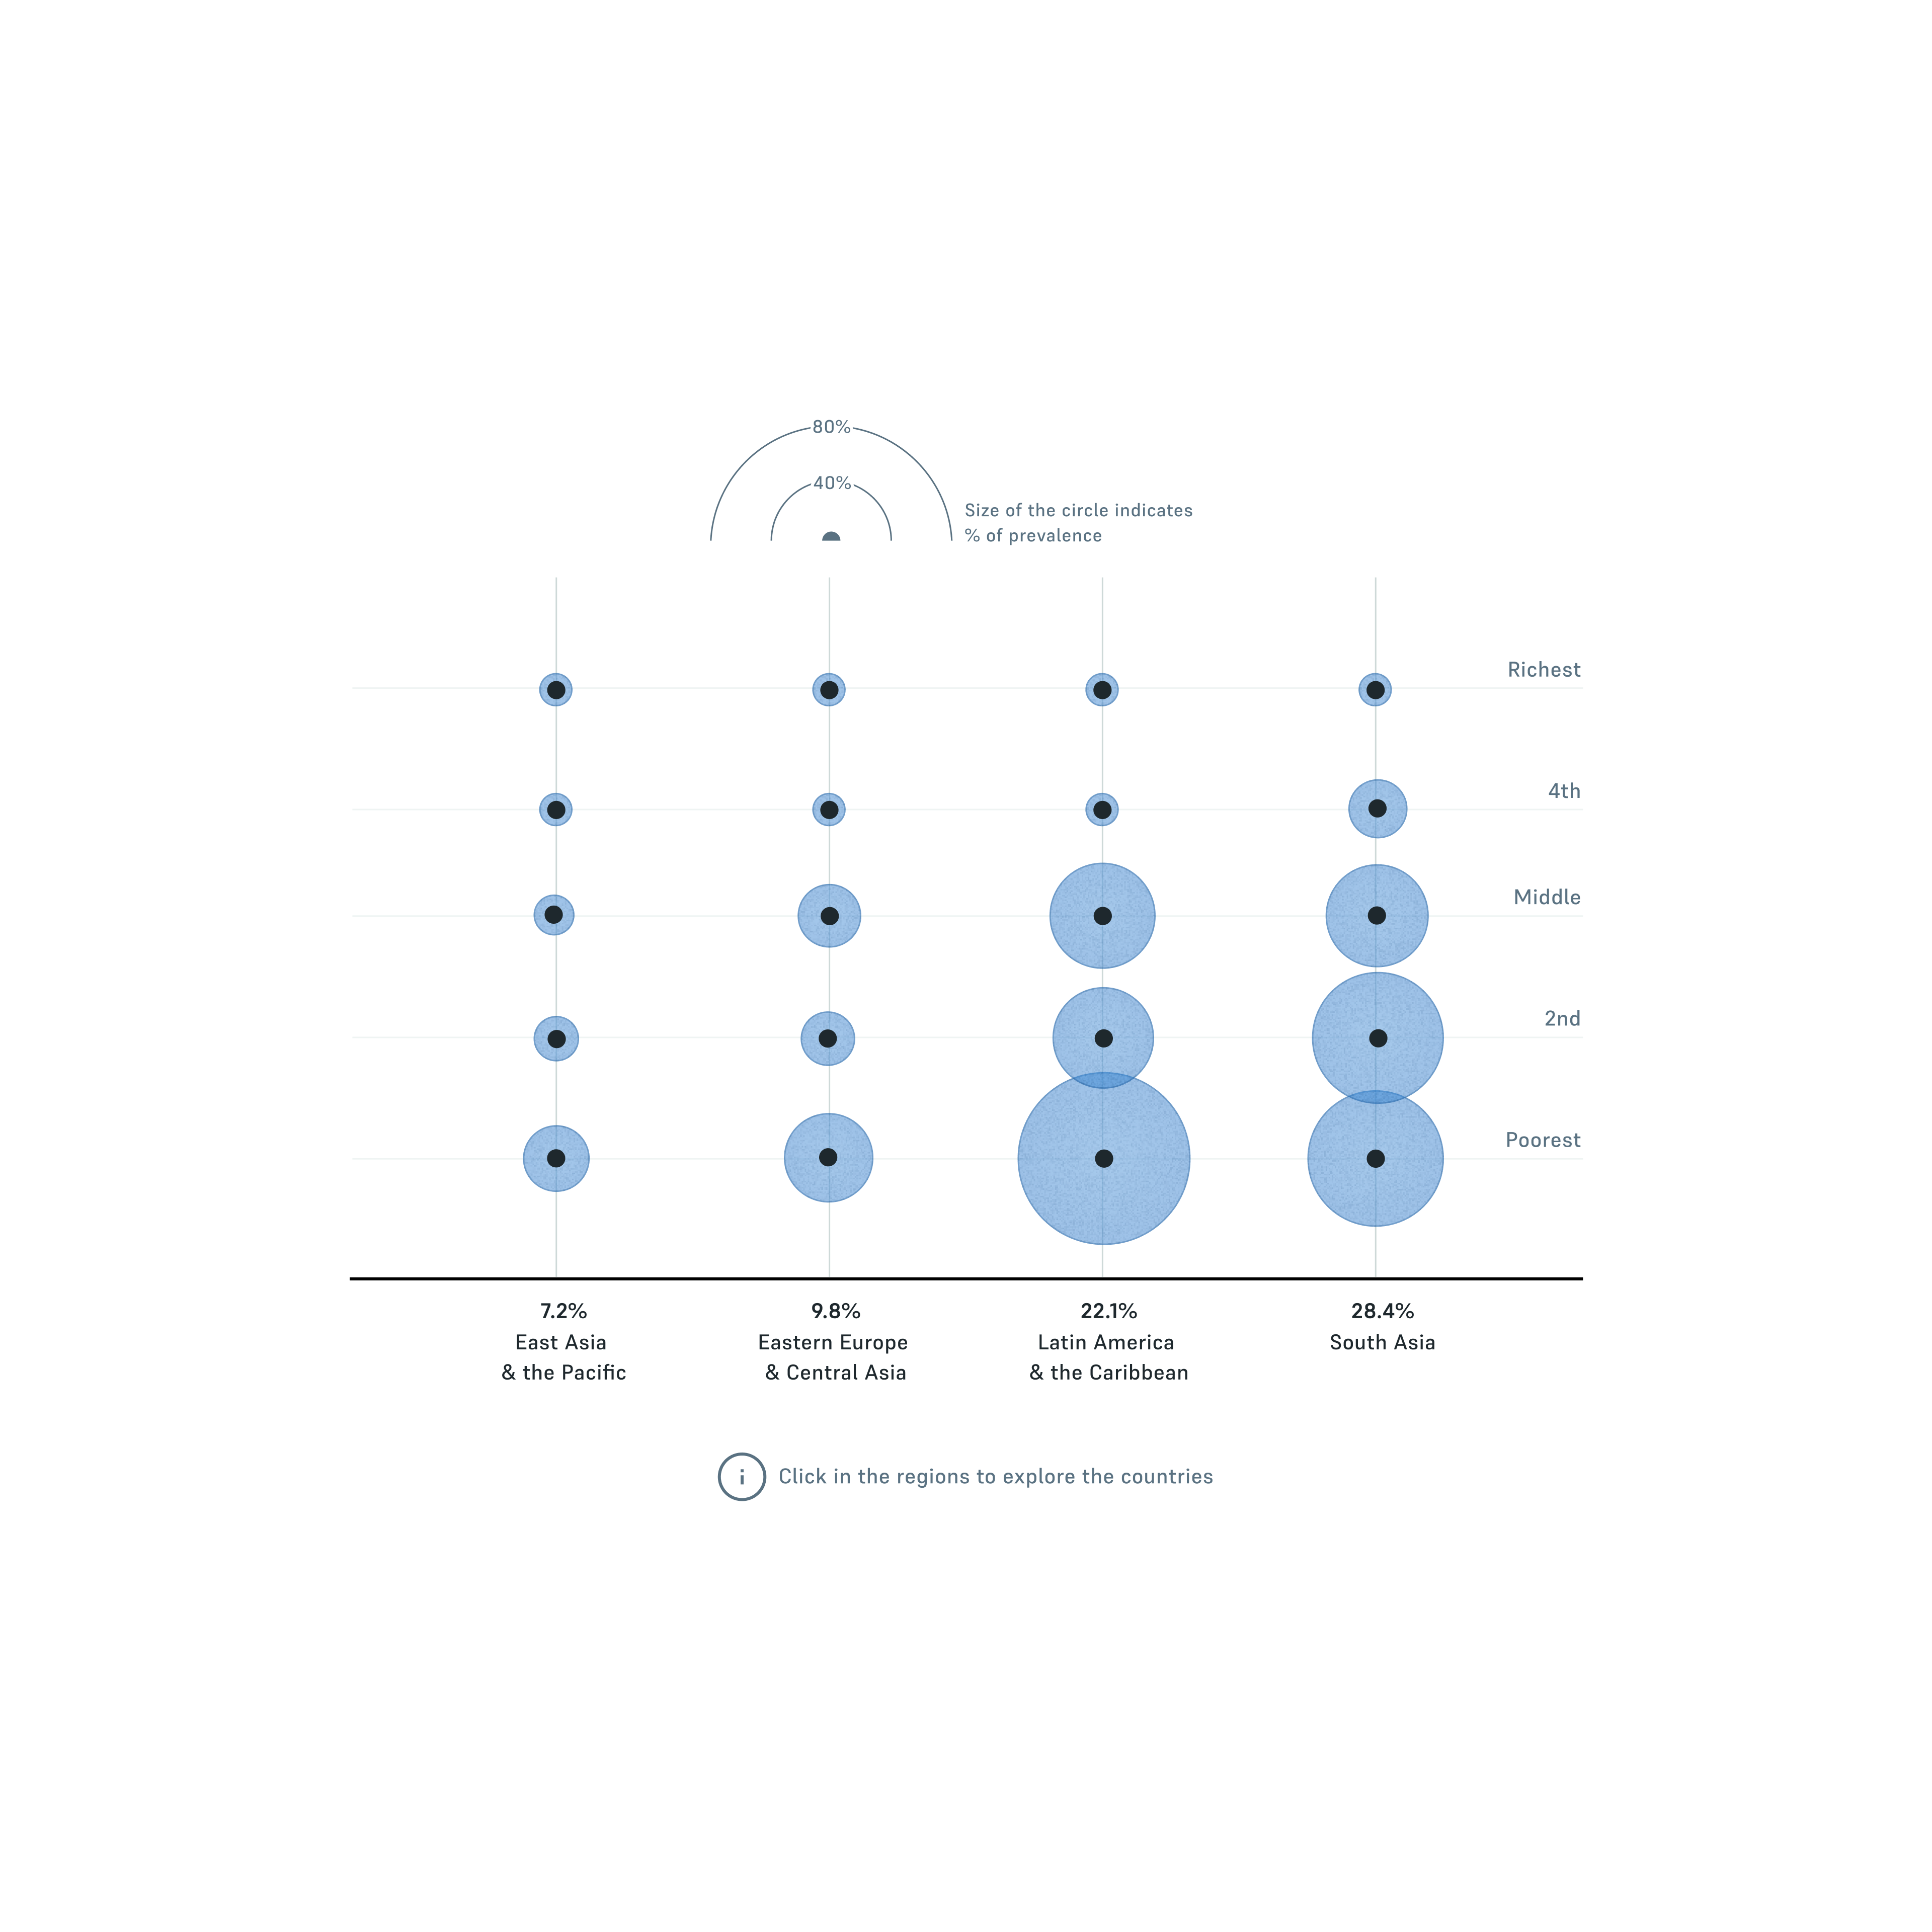
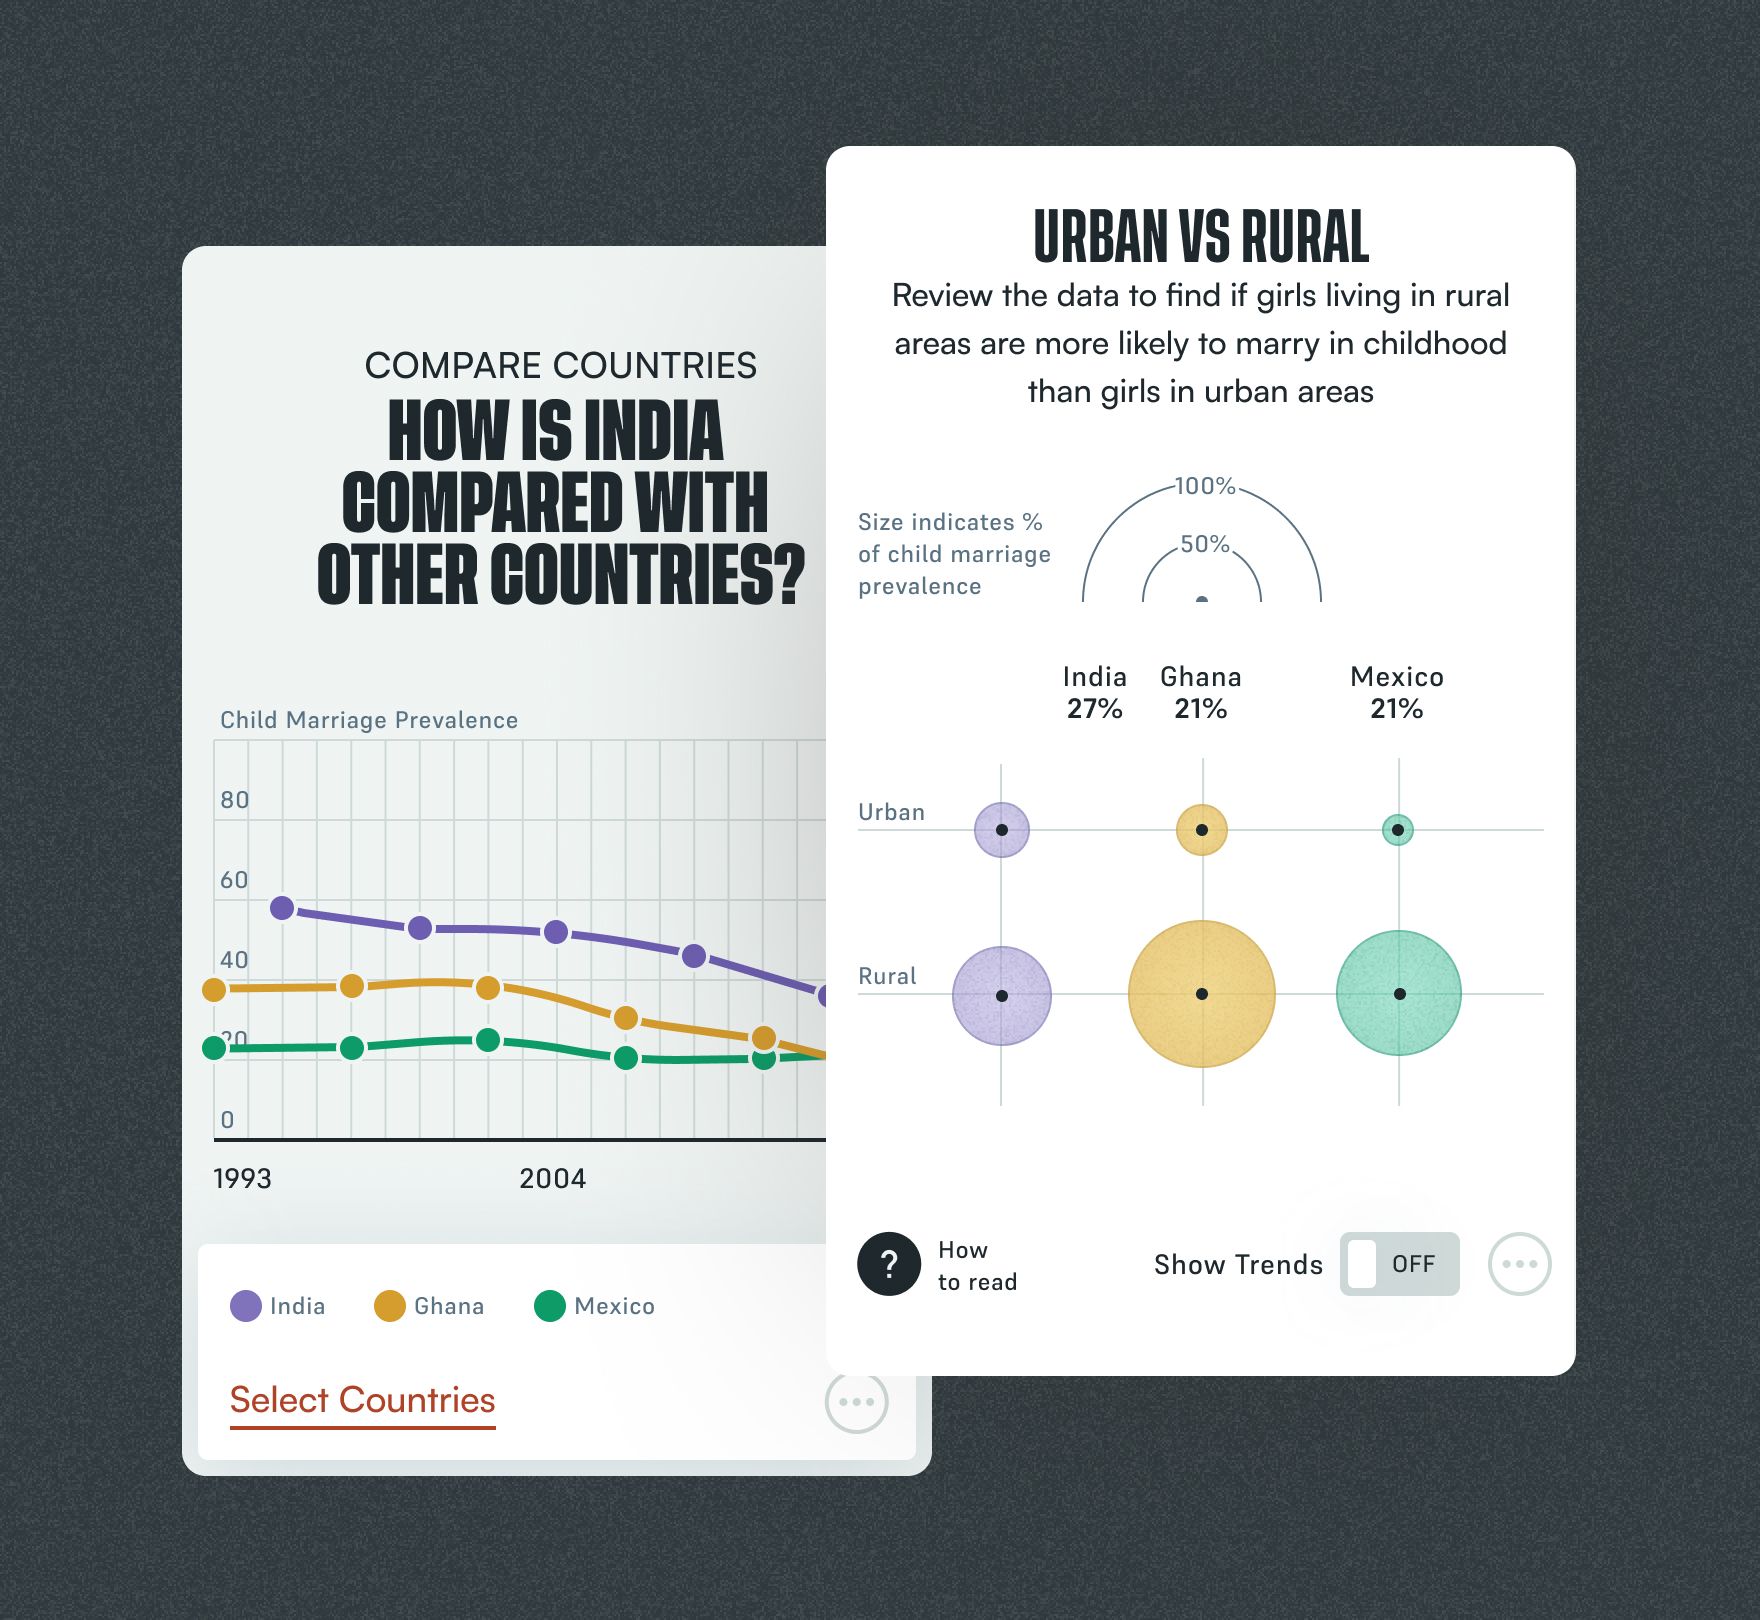
Comparing is where the profiles open up to analysis. People choose the countries they want to set side by side and follow their trends over time. Further graphics break each comparison down by who is most at risk: urban or rural areas, wealth, education and more. A "how to read" guide helps interpret them, as in the urban and rural graphic shown here, where the size of each bubble shows prevalence.
The pace is ours to change
The portal turns ending child marriage from a distant target into a path that anyone can follow. Policymakers and advocates can see how far each region and country has come, where the next years lead at the current pace, and how much closer 2030 gets if progress speeds up, all in one place and read the same way at every scale.
The Child Marriage Monitoring Mechanism announced the launch of the portal in December 2023. It has since been recognized with an Awwwards Honorable Mention and a longlist place in the Humanitarian category of the Information is Beautiful Awards 2024.
The team
Domestic Data Streamers: Client side / Art Direction / Development
Ezequiel Salatino: Web design / Data visualization