Child Atlas
What does child mortality have to do with climate risk?
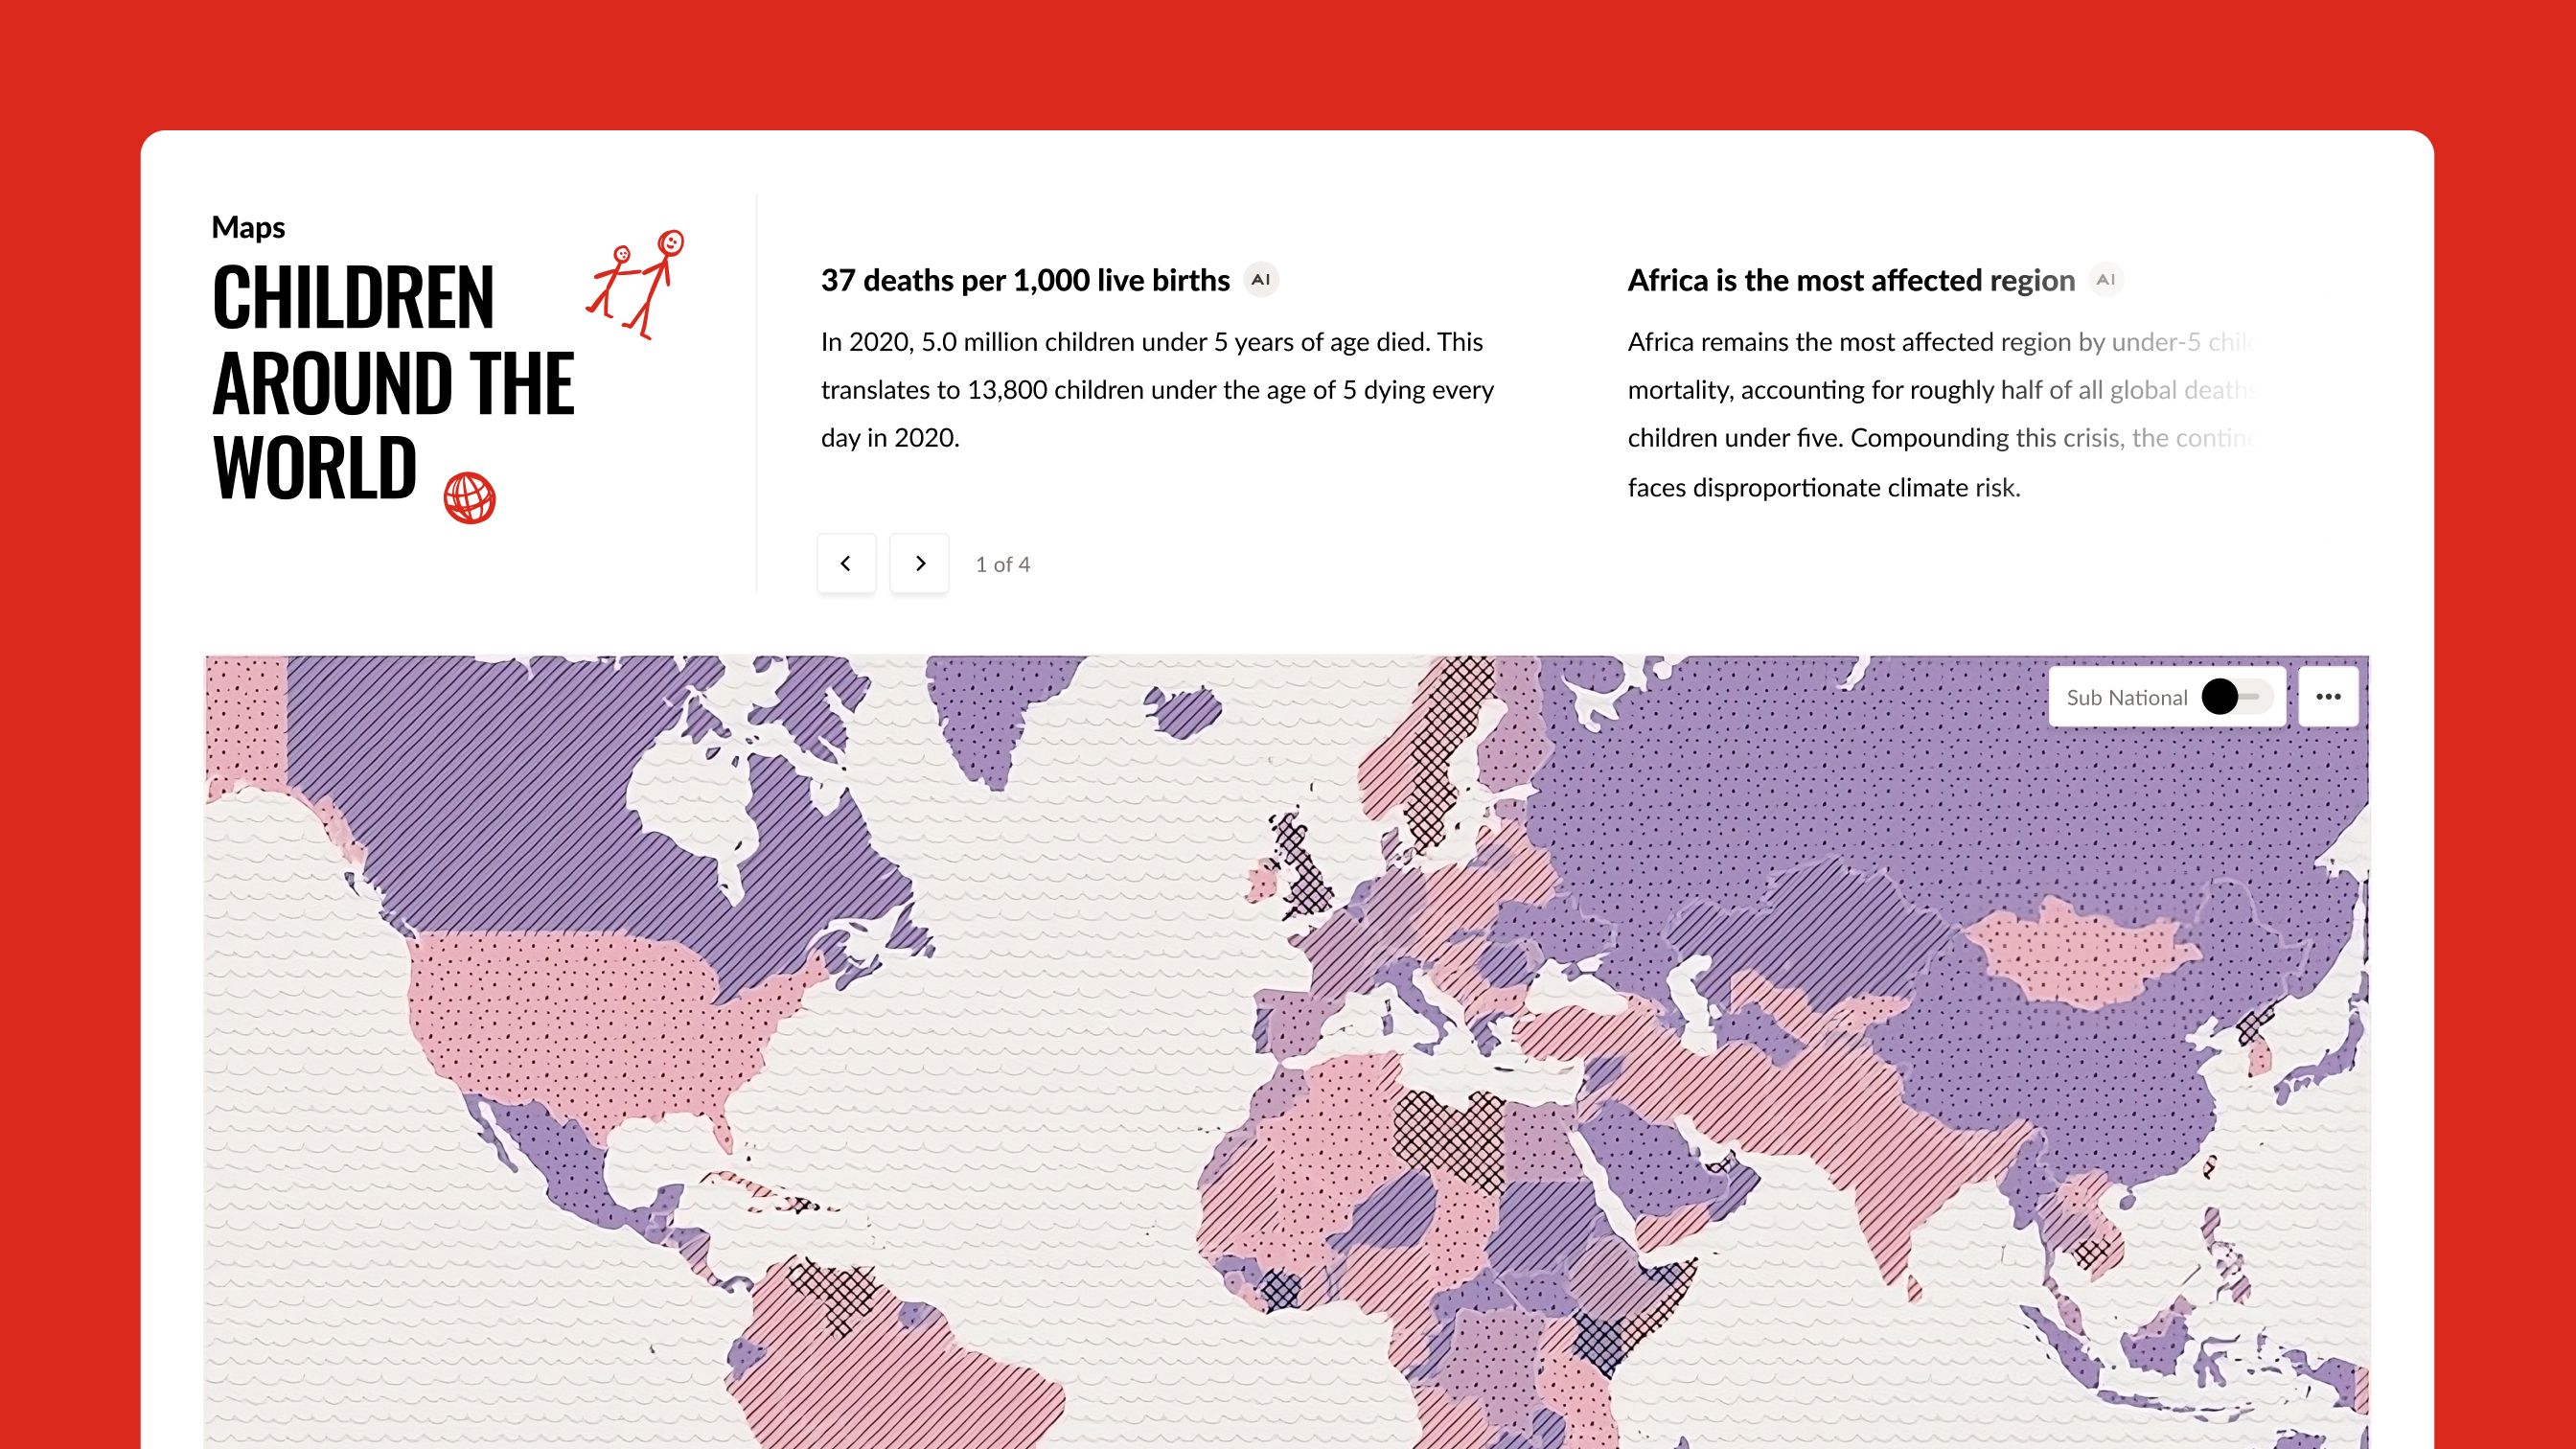
Child Atlas is Save the Children's global data platform on how children are doing. Its core is a bivariate map: pick any two indicators, from child mortality and learning poverty to climate risk, hunger or public spending, and see where they overlap. I designed the web interface and the visualizations that turn that data into something anyone can read and compare.
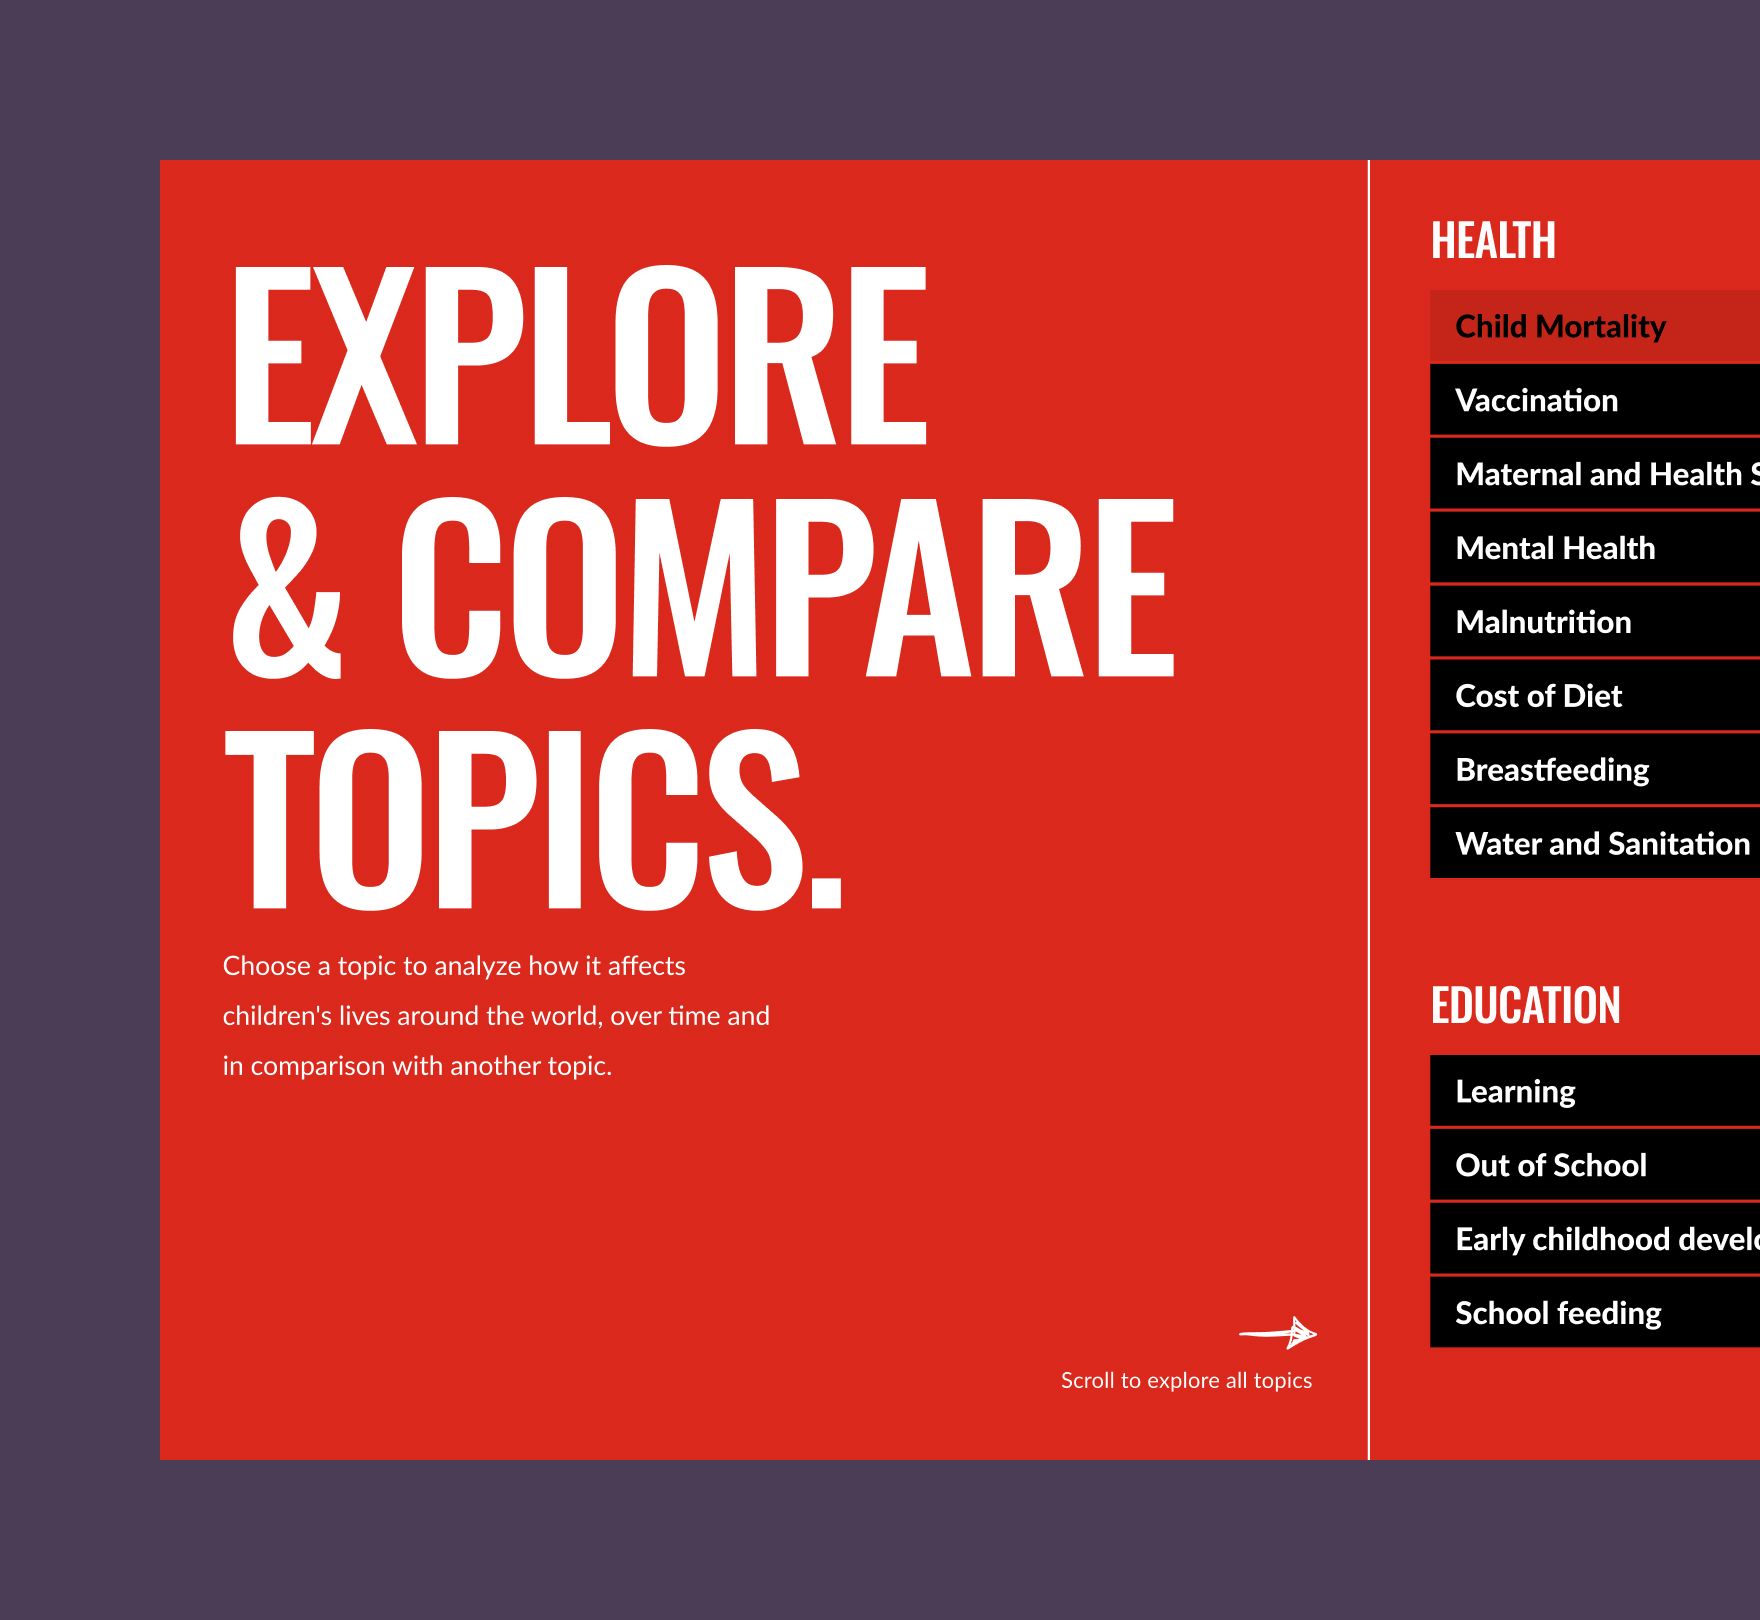
Comparing across sources. The Atlas brings together very different data sources, from health and education to climate and financing. Looking at one indicator at a time was not enough: the challenge was to let people compare them and discover how topics relate to each other, and where new questions and opportunities appear. We explored different ideas for showing the relationship between the two datasets a person selects, so the connection is something you can see, not something you have to work out.
Precise, but human. The interface had to feel technical and precise without losing its human side. This is data about children, and they had to stay at the core of the experience.
The space between two datasets
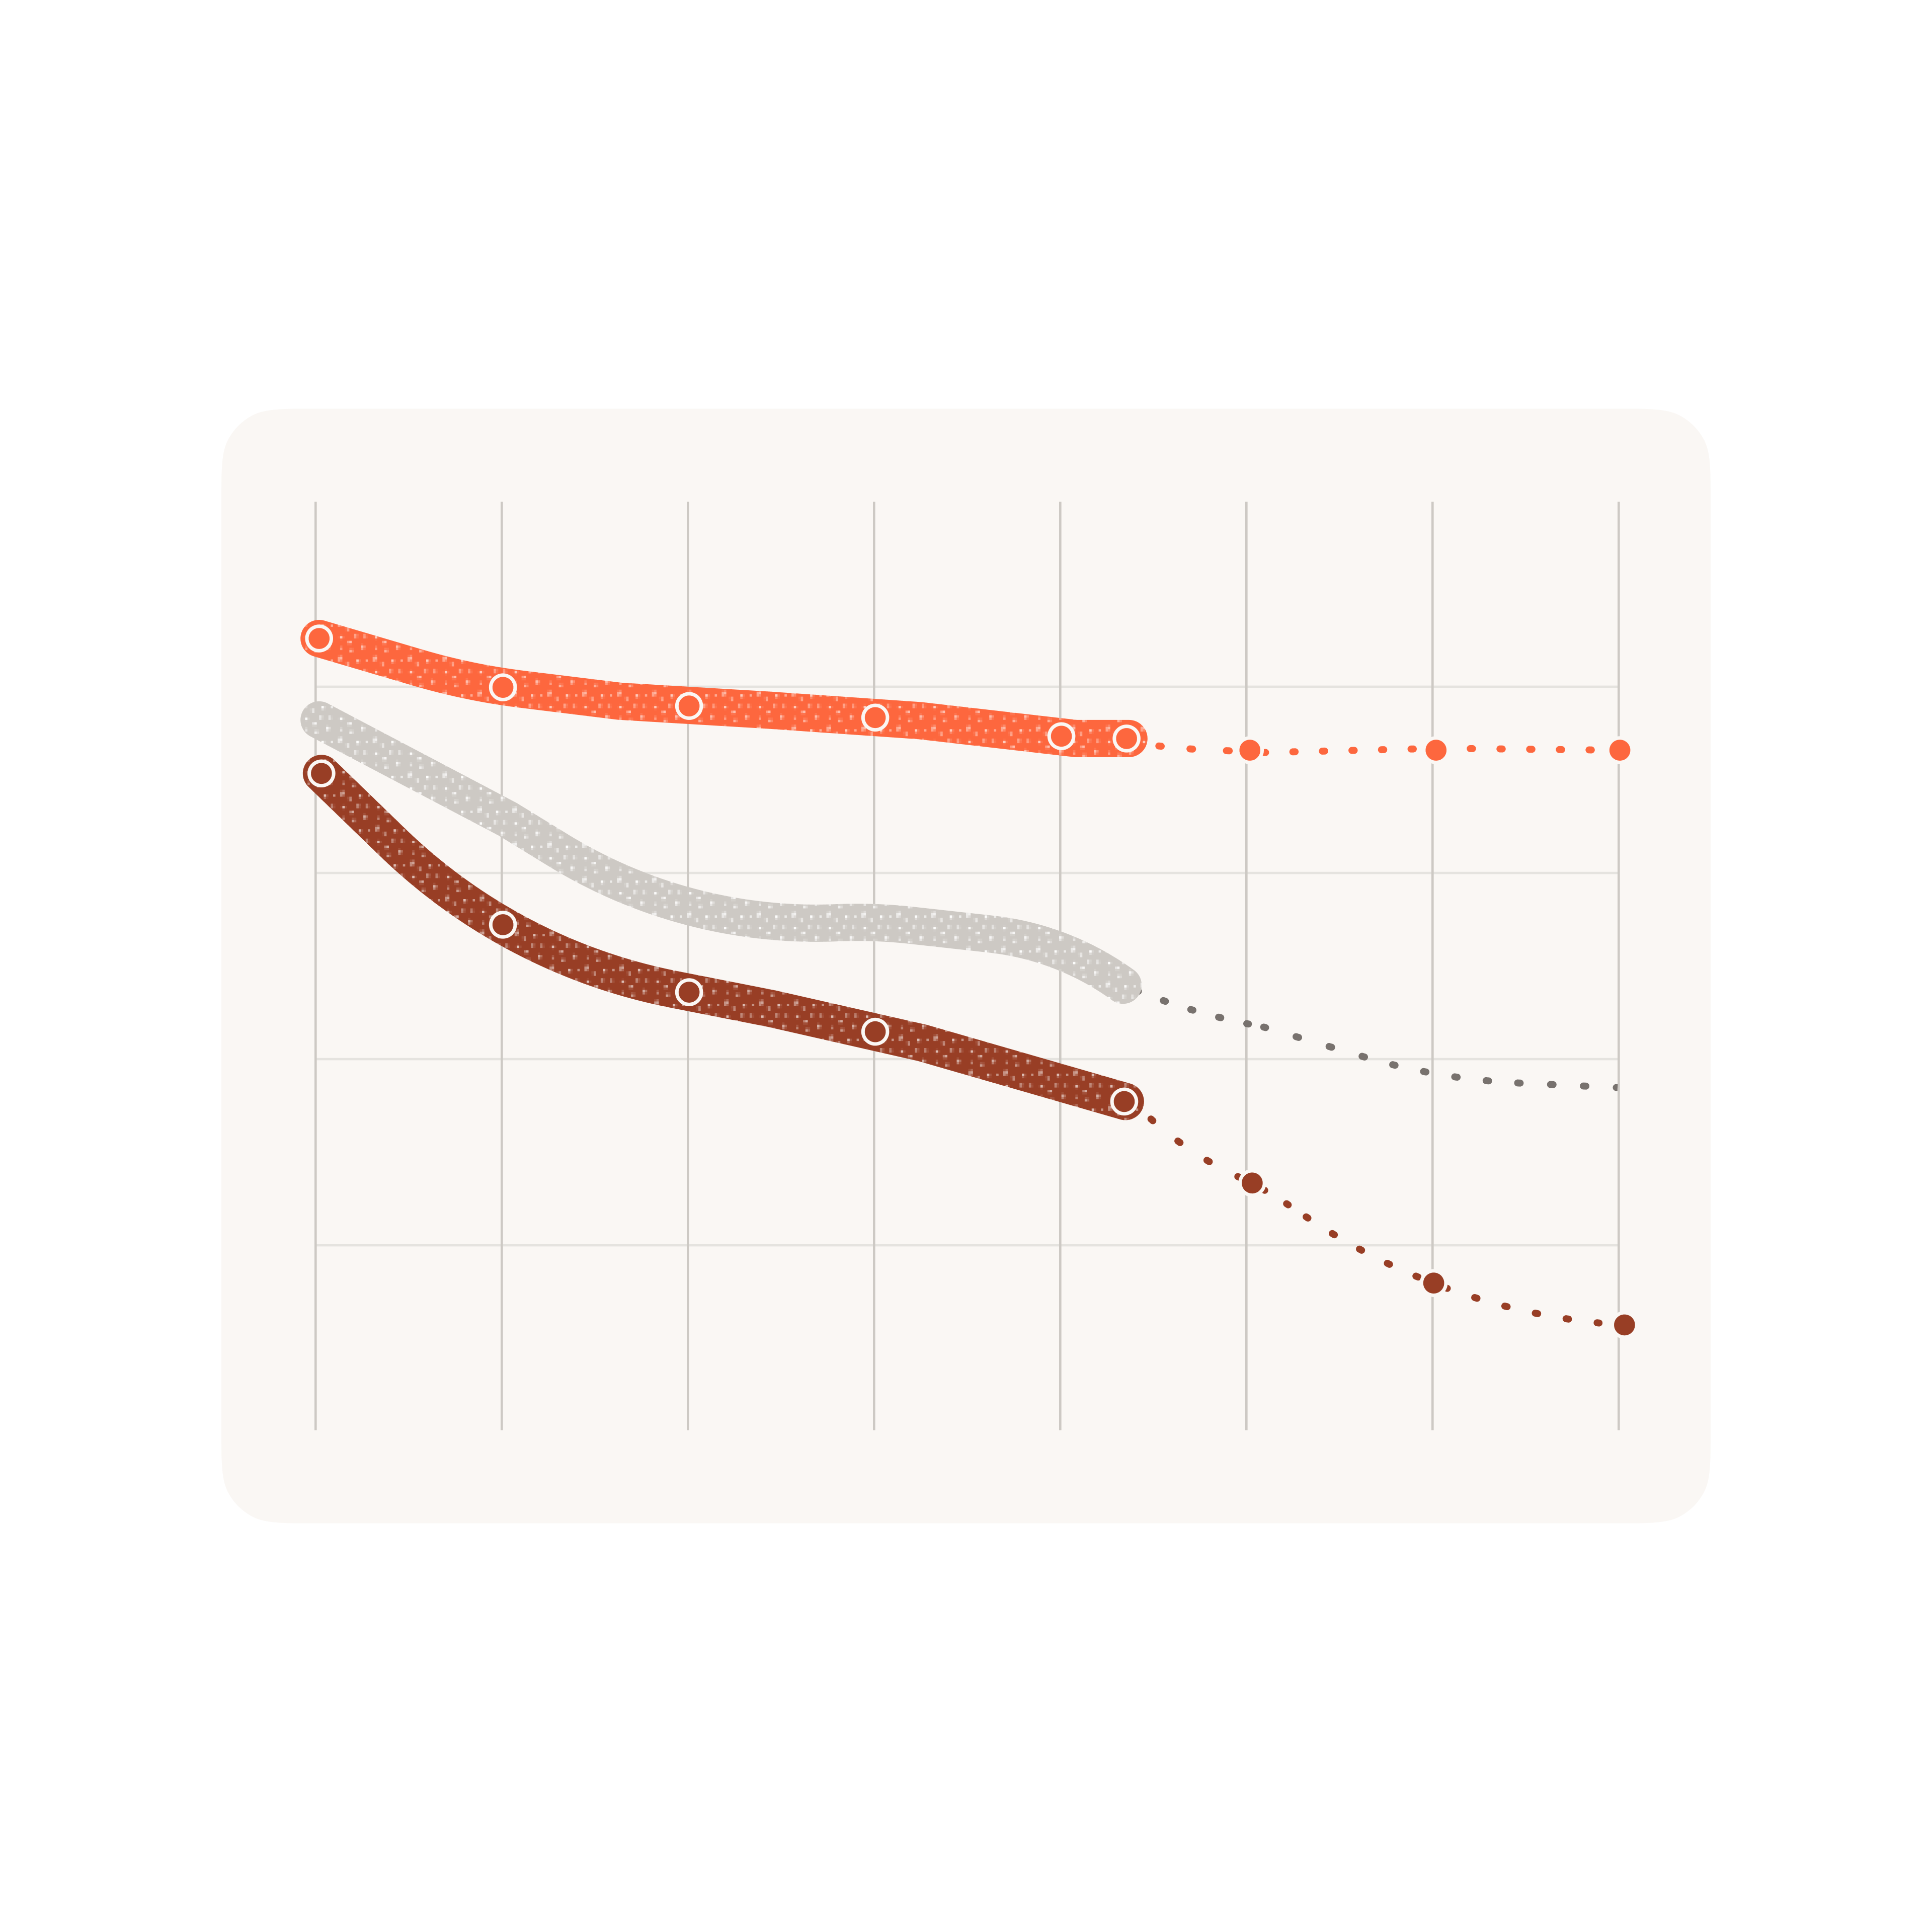
Every graphic in the Atlas is built around a comparison: one indicator against another on the map and the scatterplot, one group of children against another in the inequality charts, and a country's position in one ranking against its position in another.
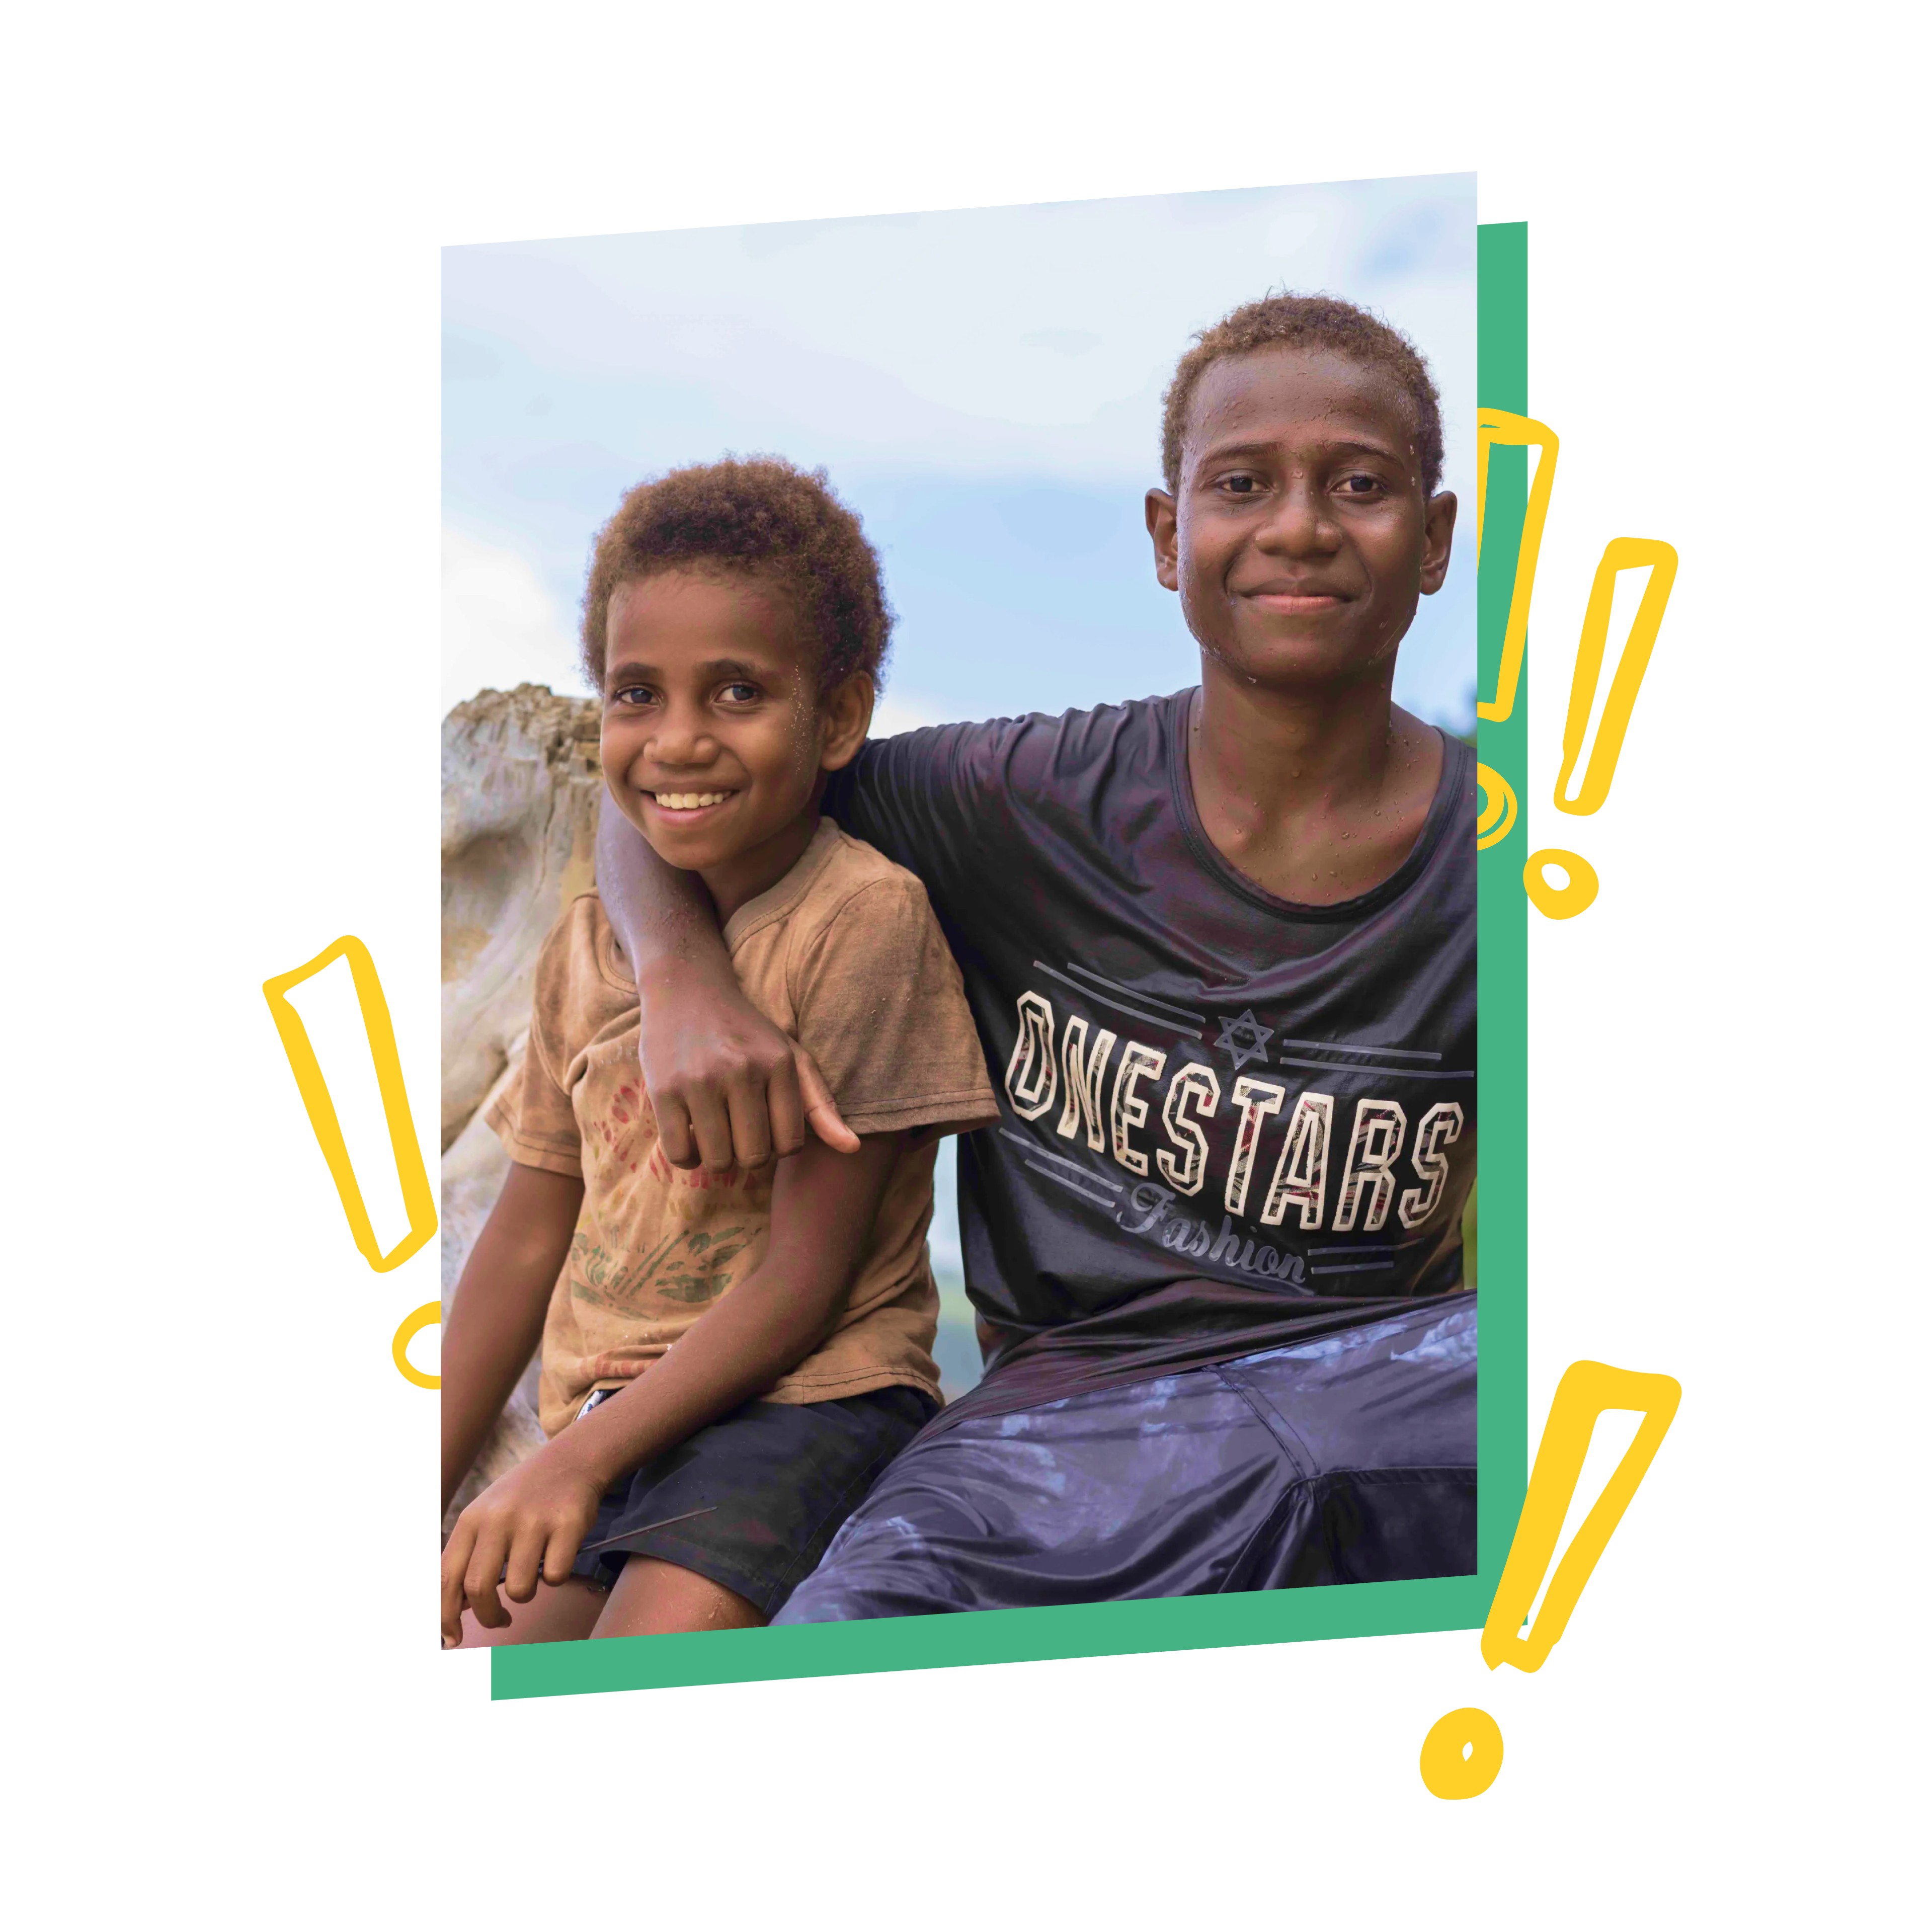
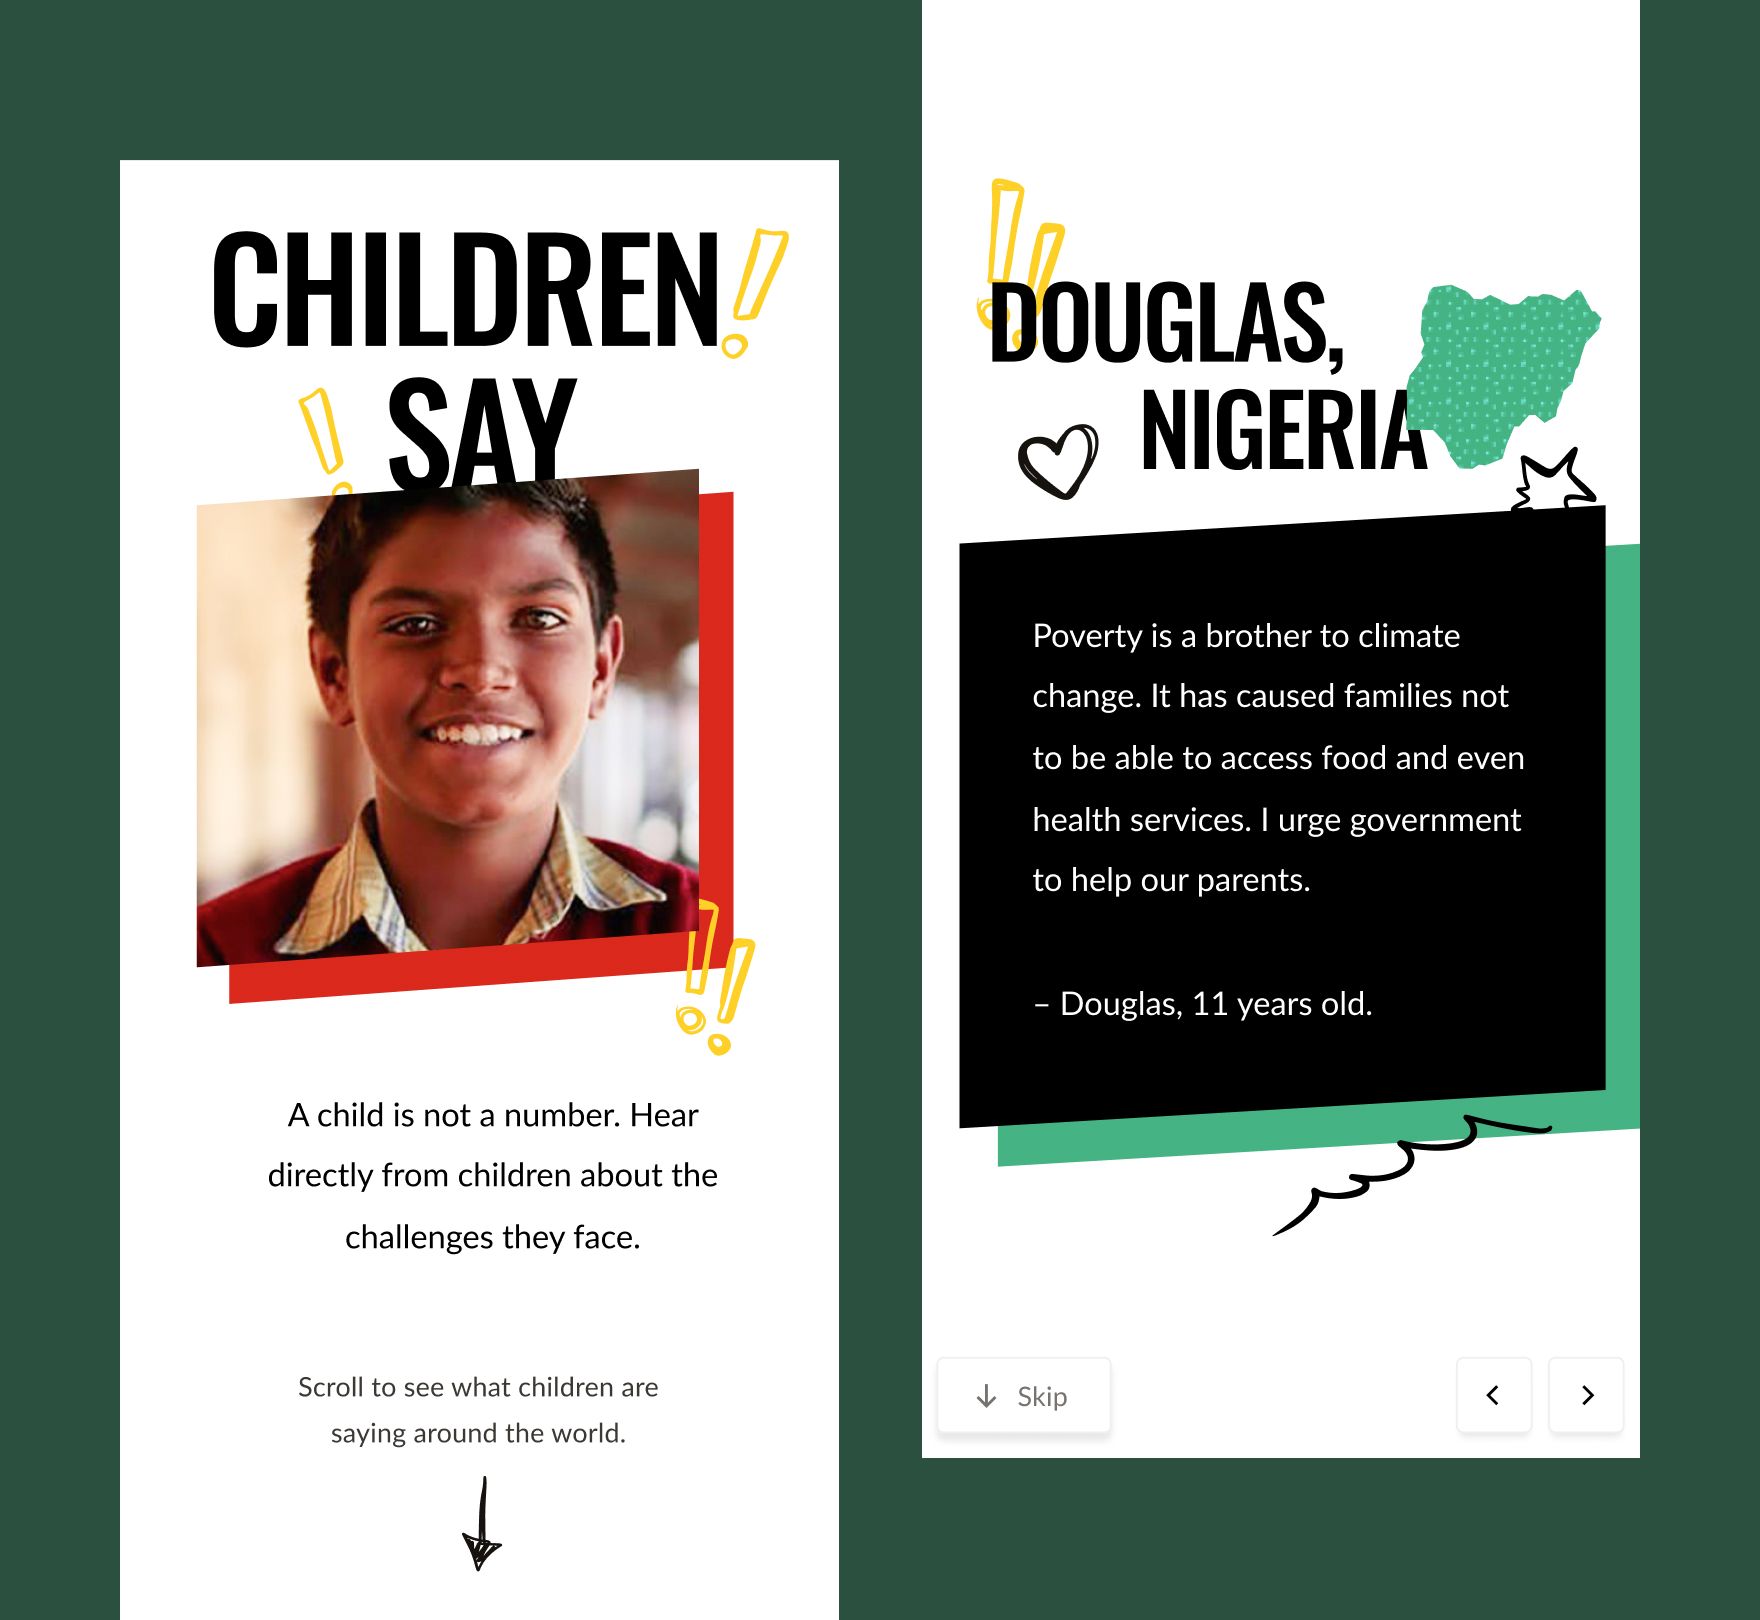
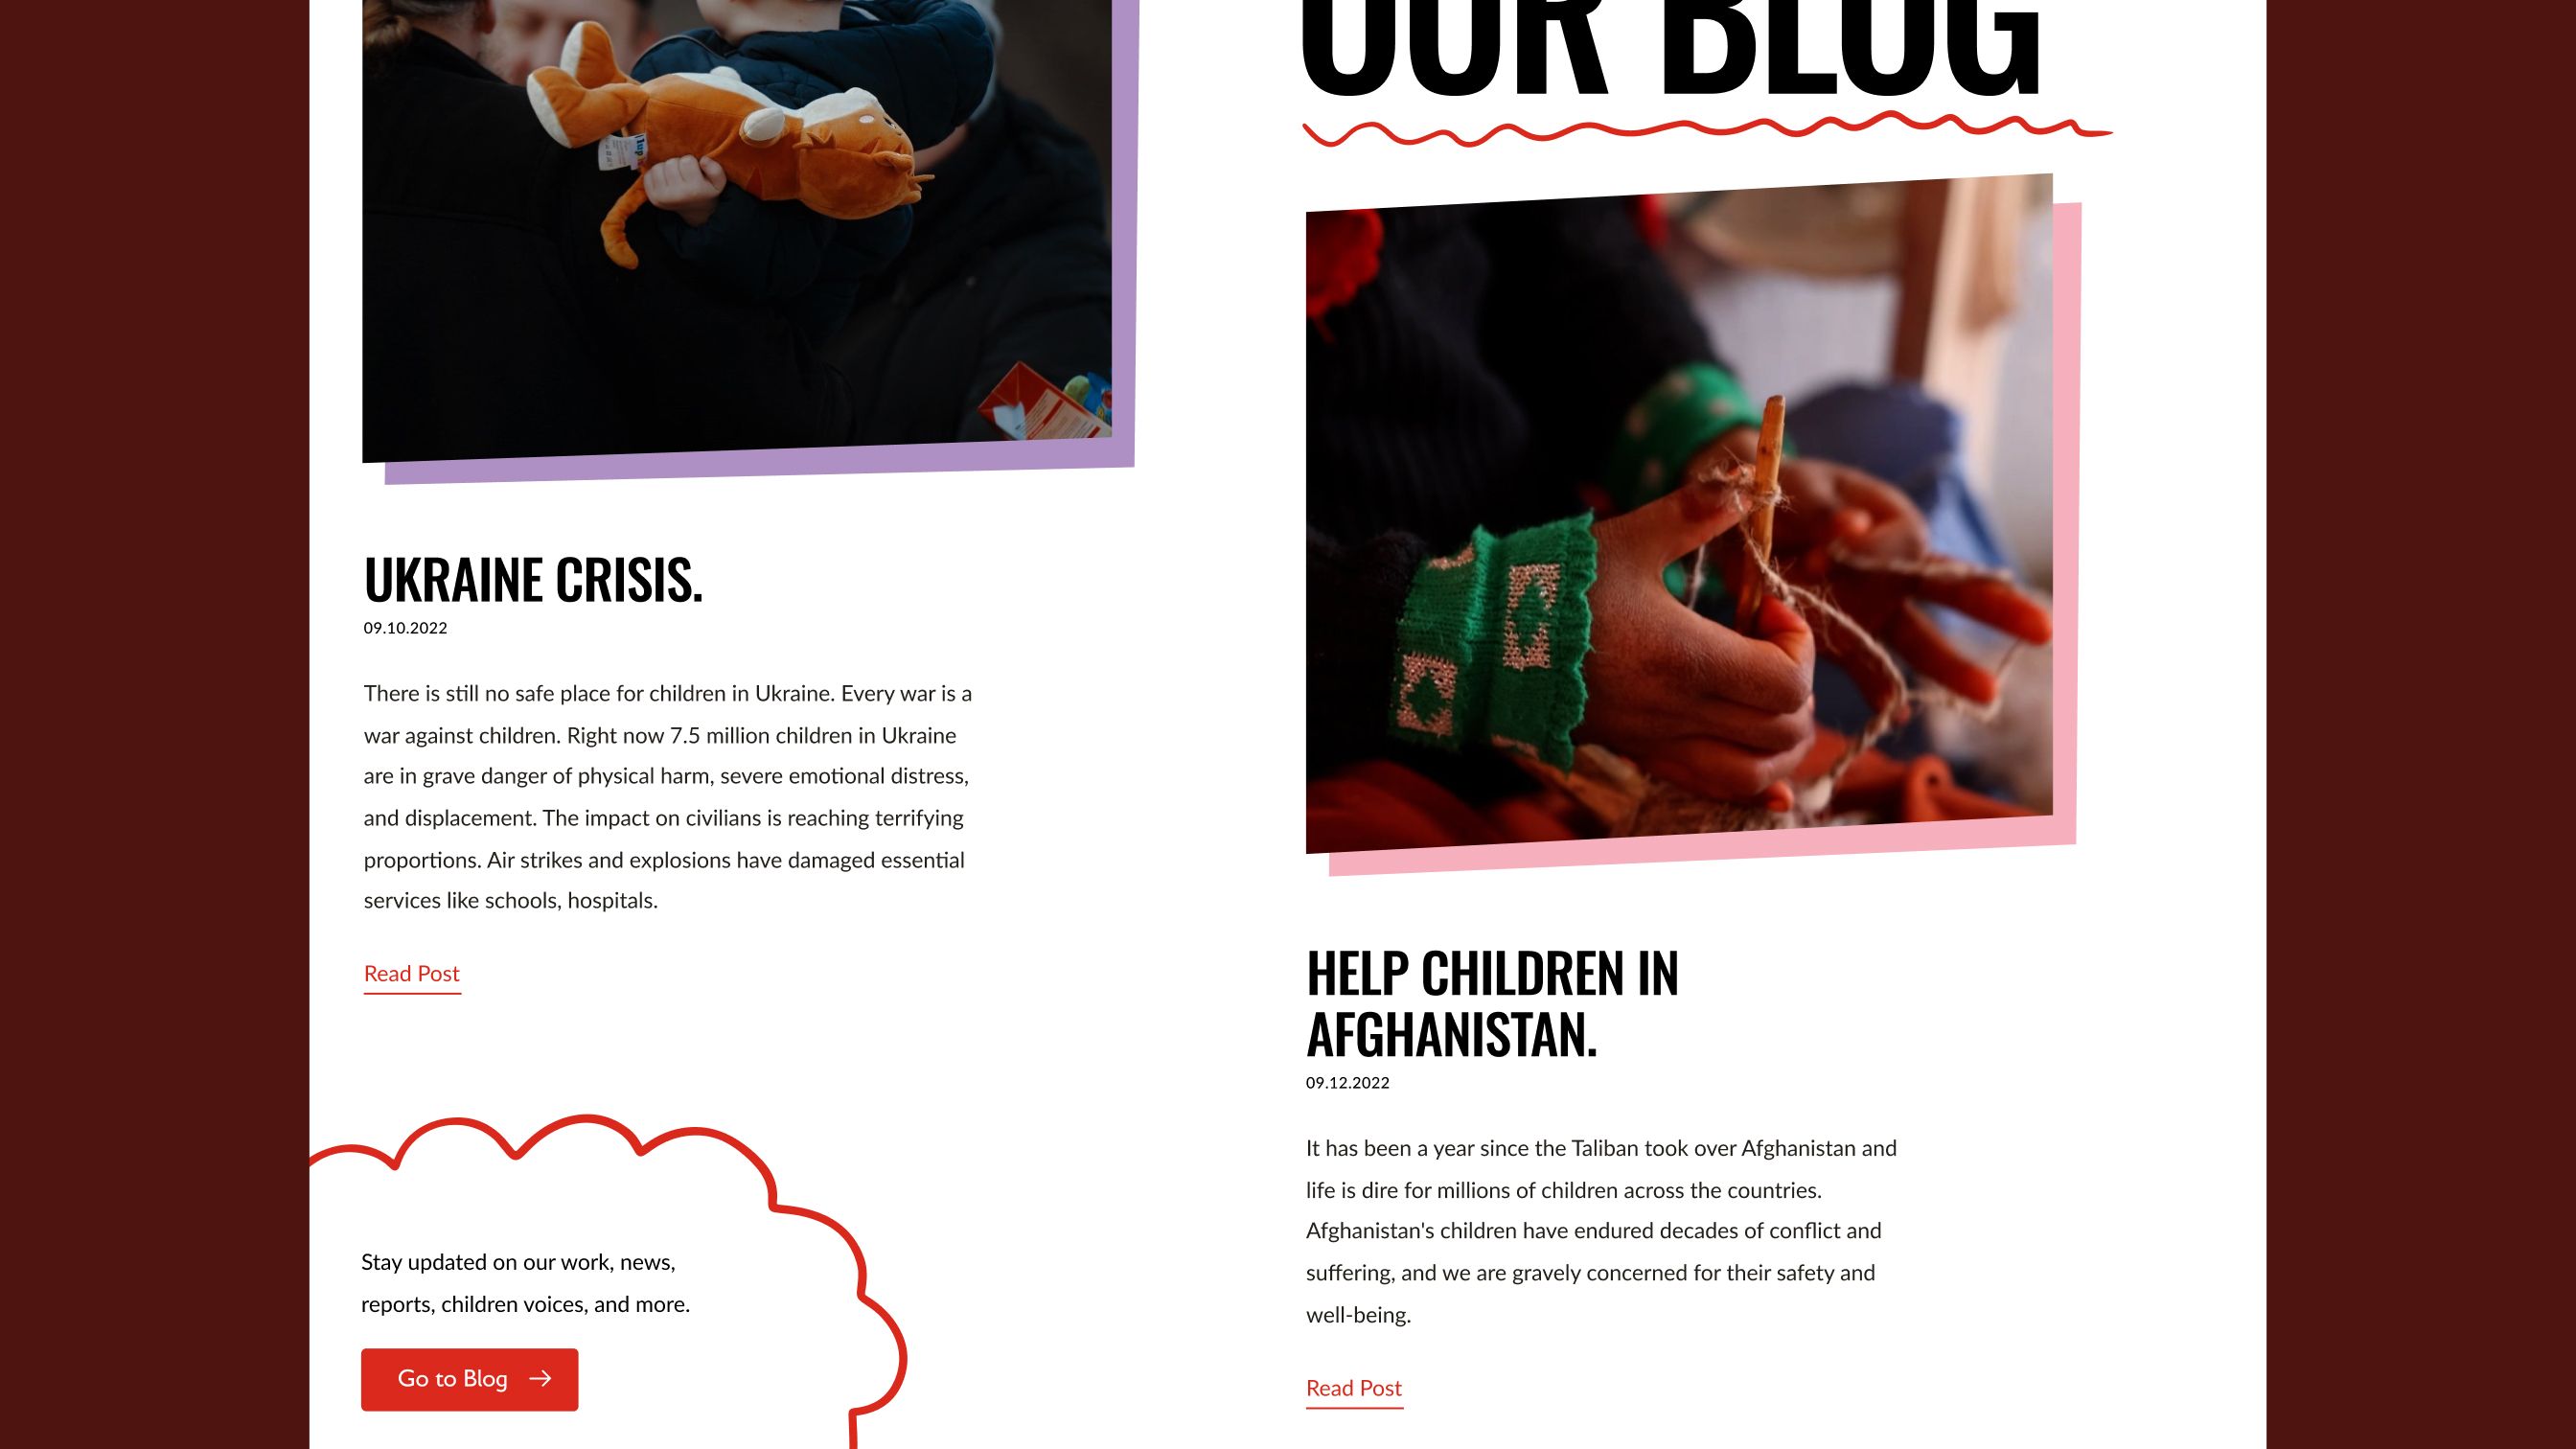
The design work was making each comparison readable at a glance and precise enough to analyze and draw insights from. The interface speaks of correlation, never cause: it shows how indicators relate, not why. To keep the focus on children, the technical graphics live alongside photographs, doodles, and children's own quotes and stories, all visually prominent in the design. The graphics themselves are composed of hand-drawn textures and lines.
Texture as the second variable.
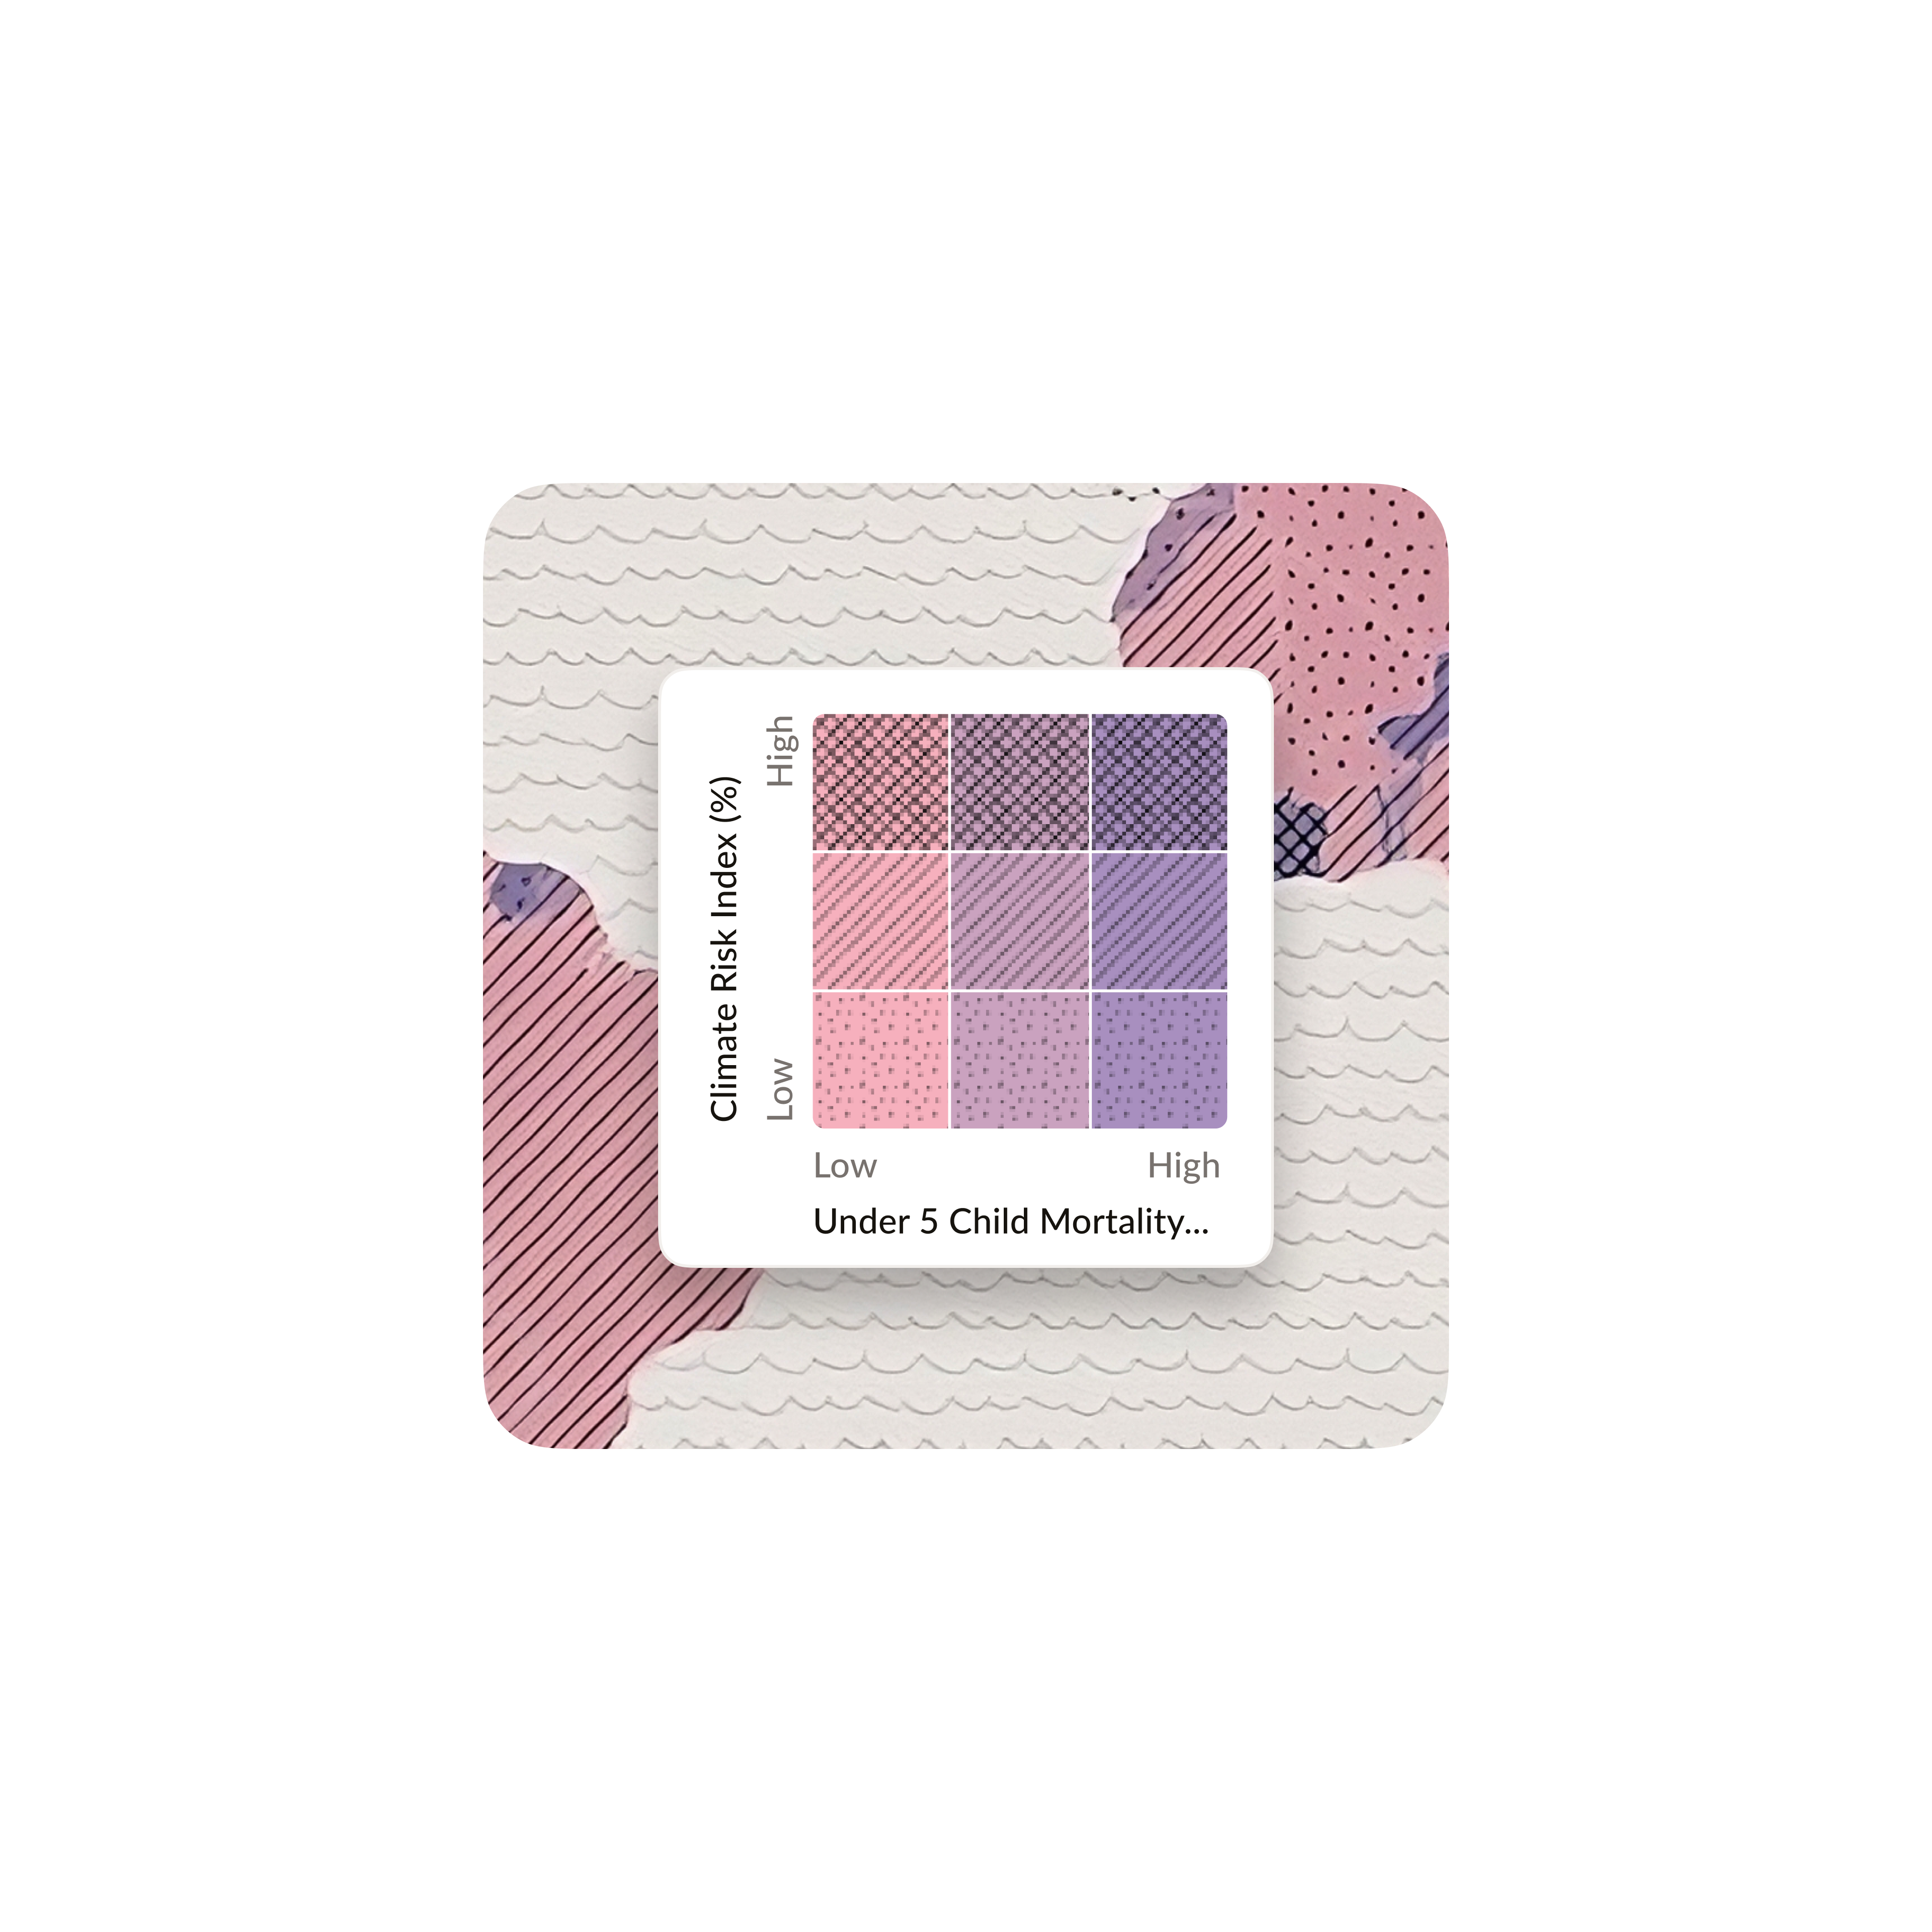
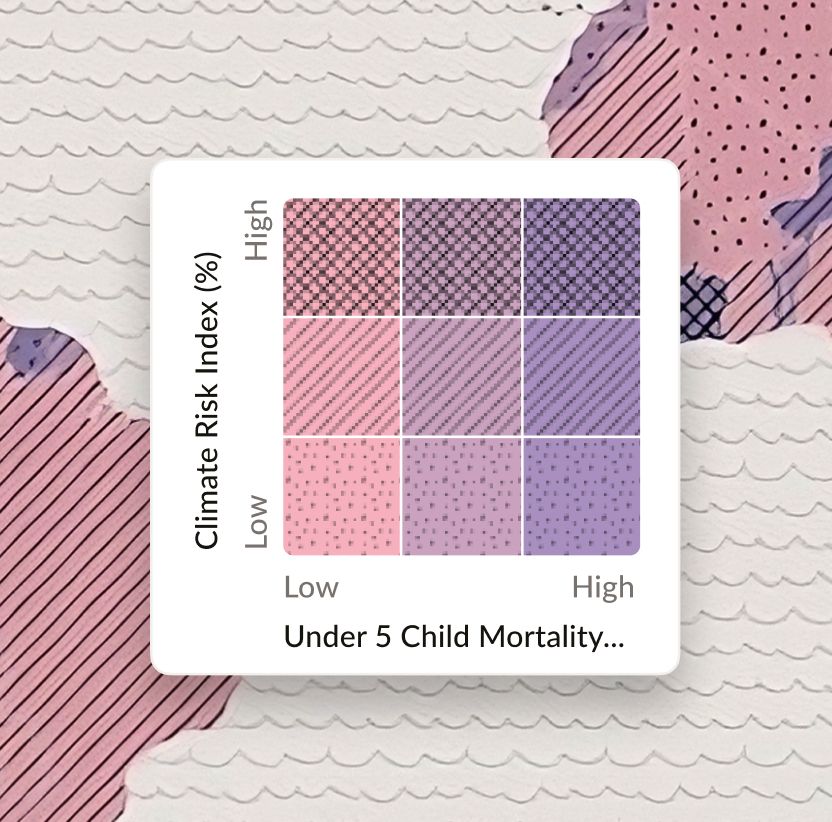
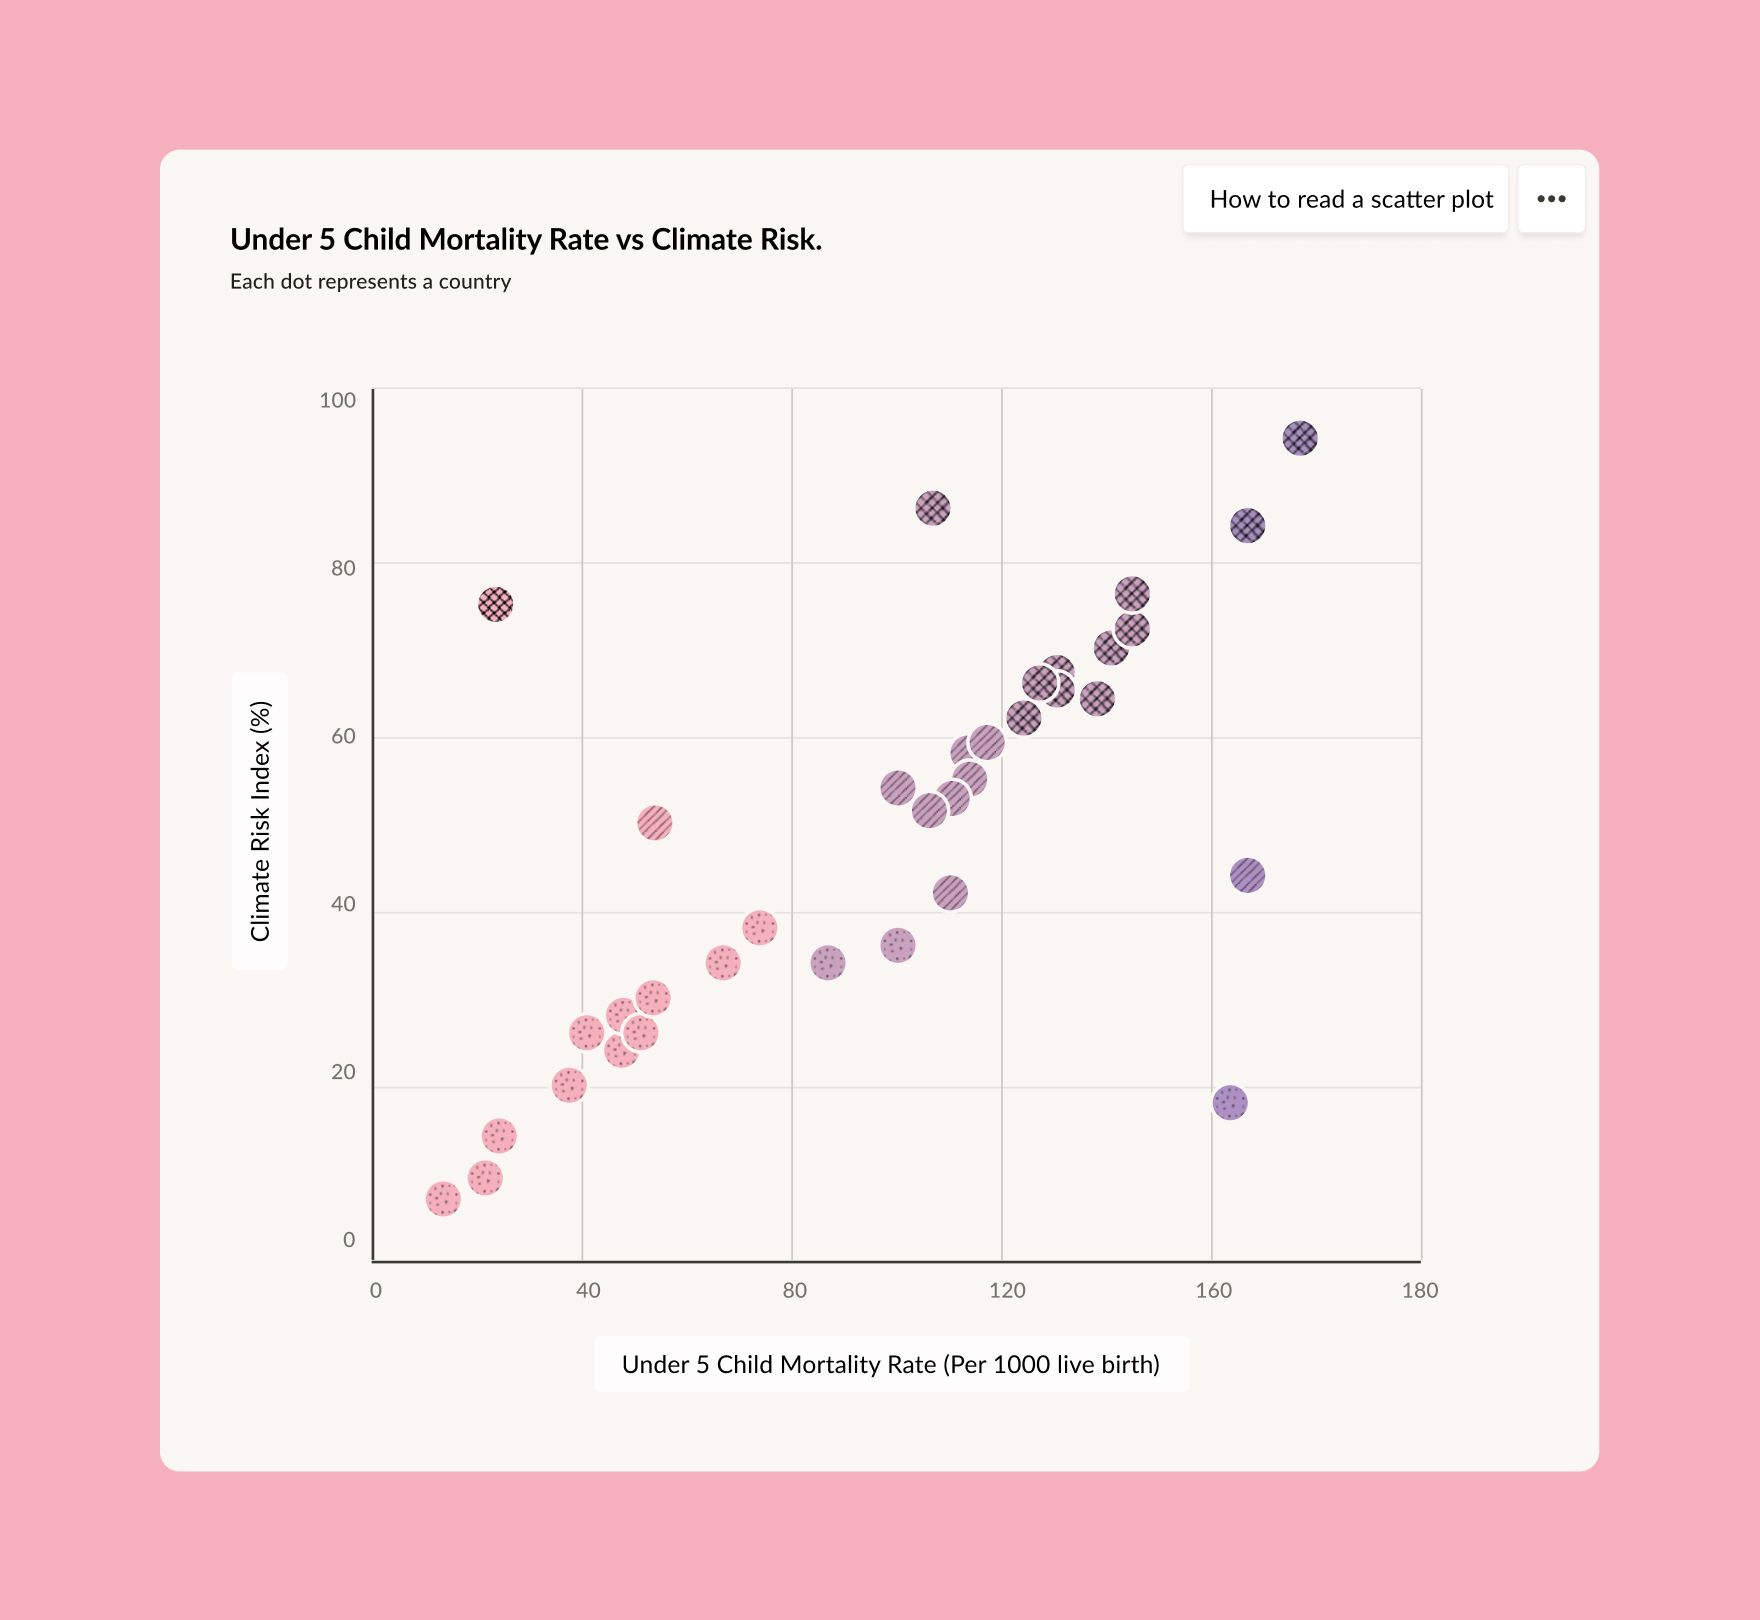
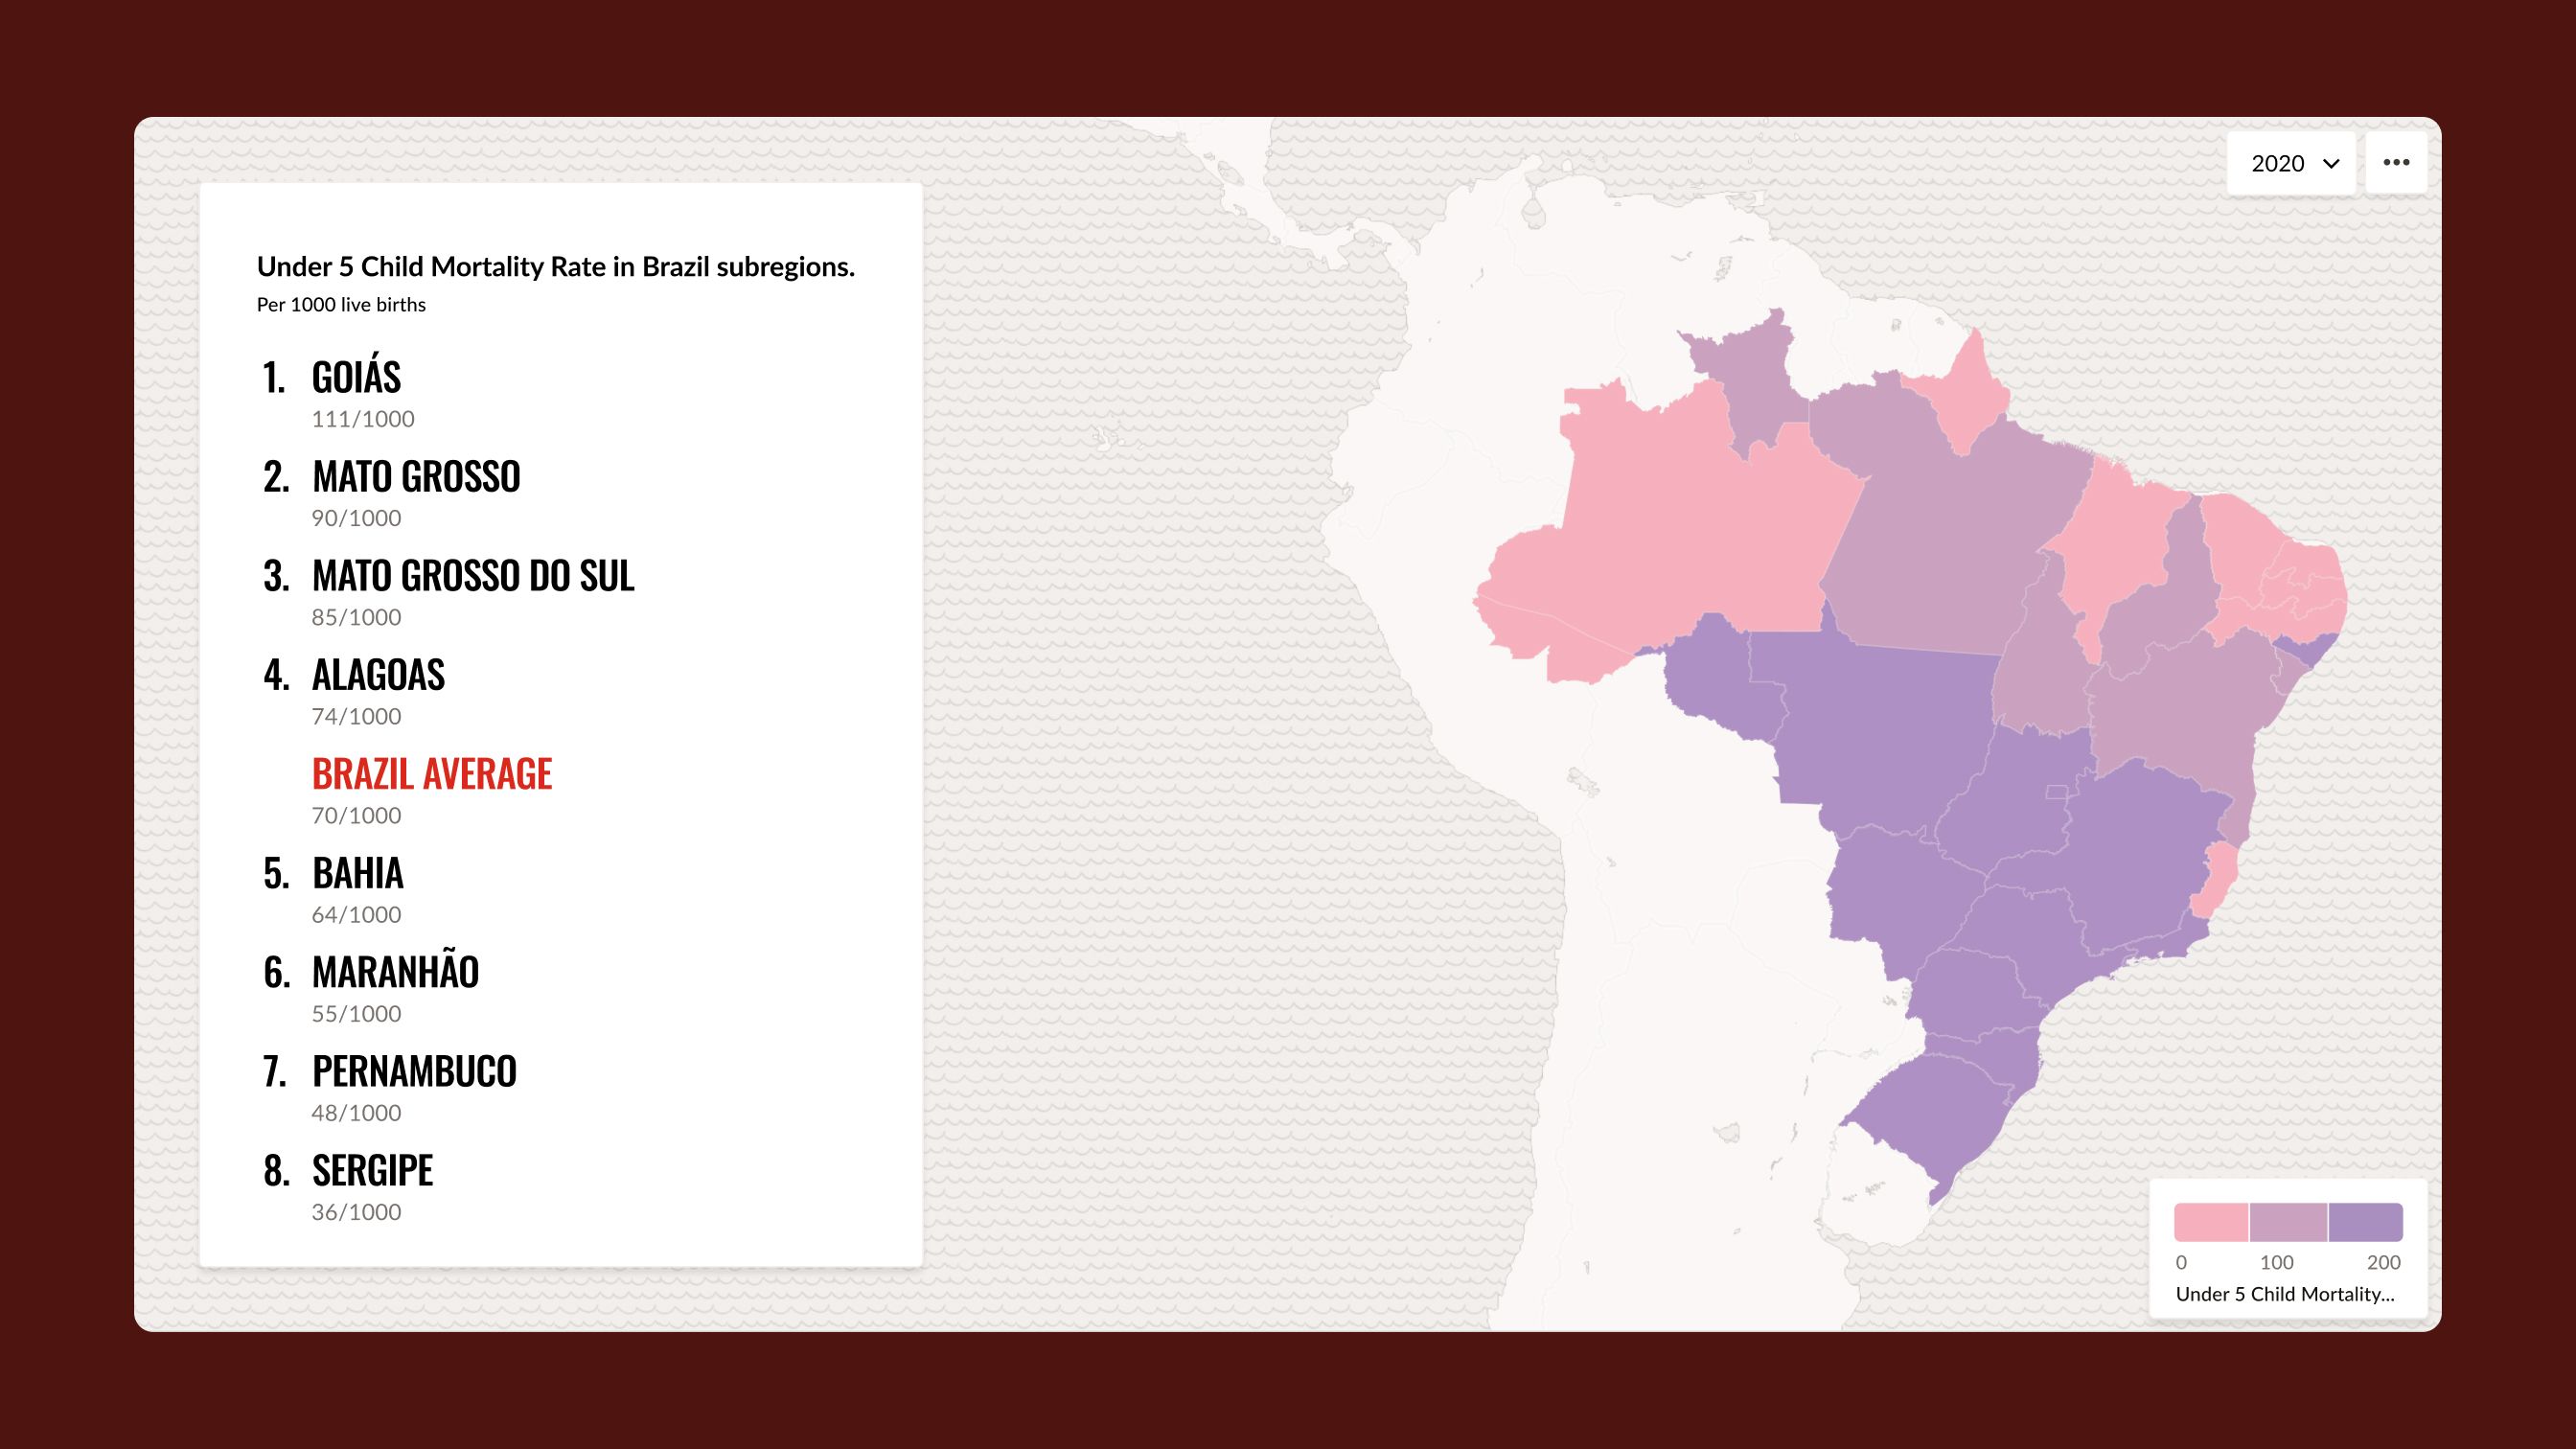
On the bivariate map, the second indicator is shown as texture, not as a second color. A second color would have pushed the map toward dark tones, at odds with a bright, colorful site. Texture also lets the hand-drawn lines and dots keep the childlike feeling of the Atlas. A scatterplot with the same two indicators sits alongside, with one dot per country.
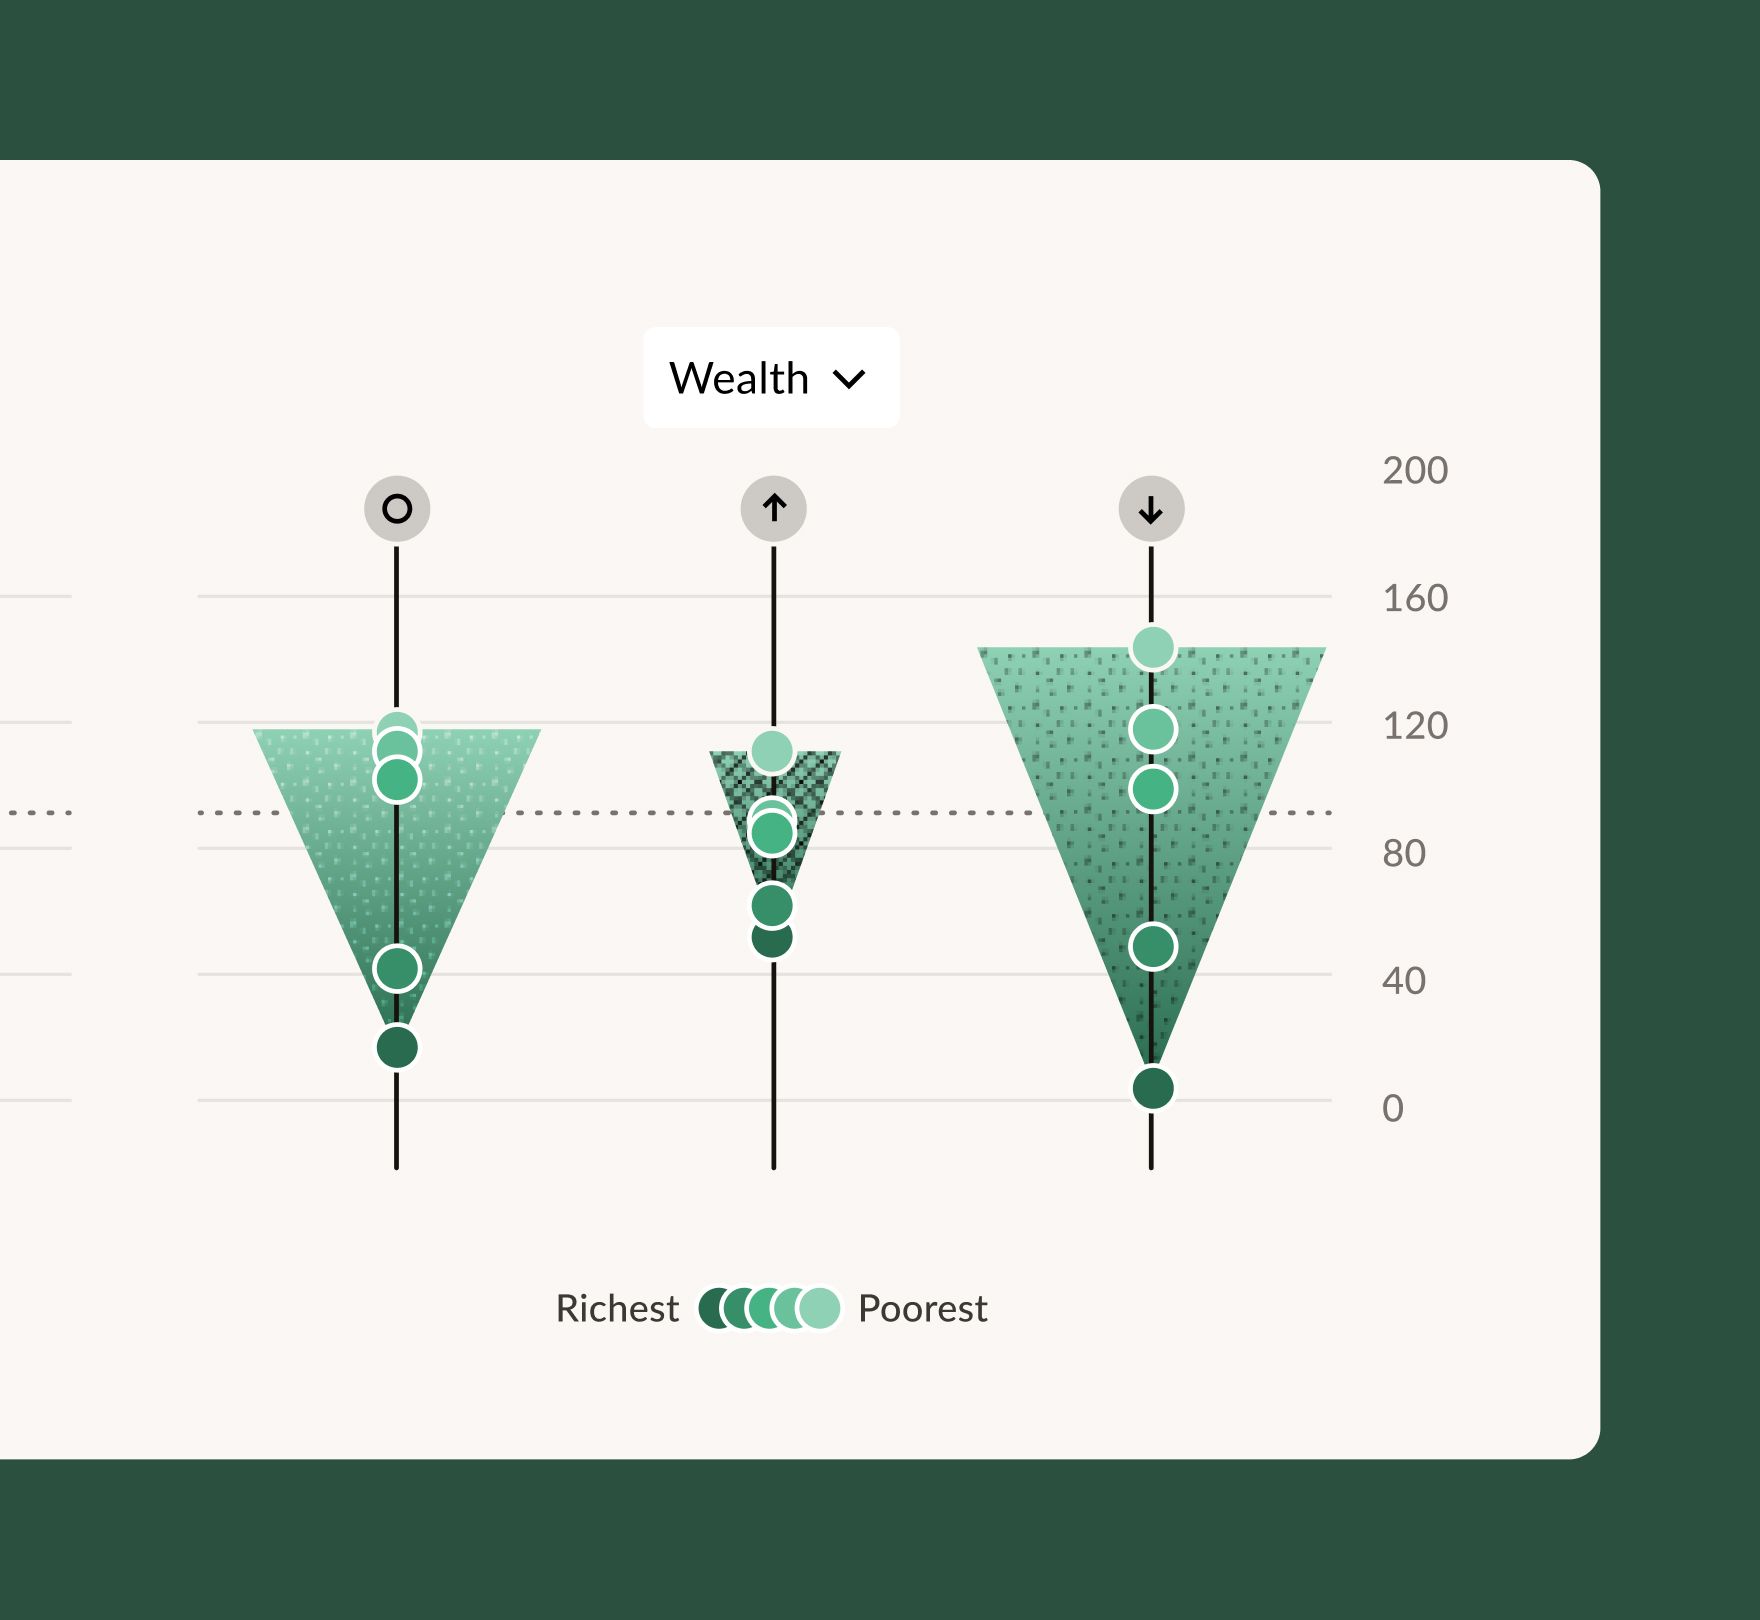
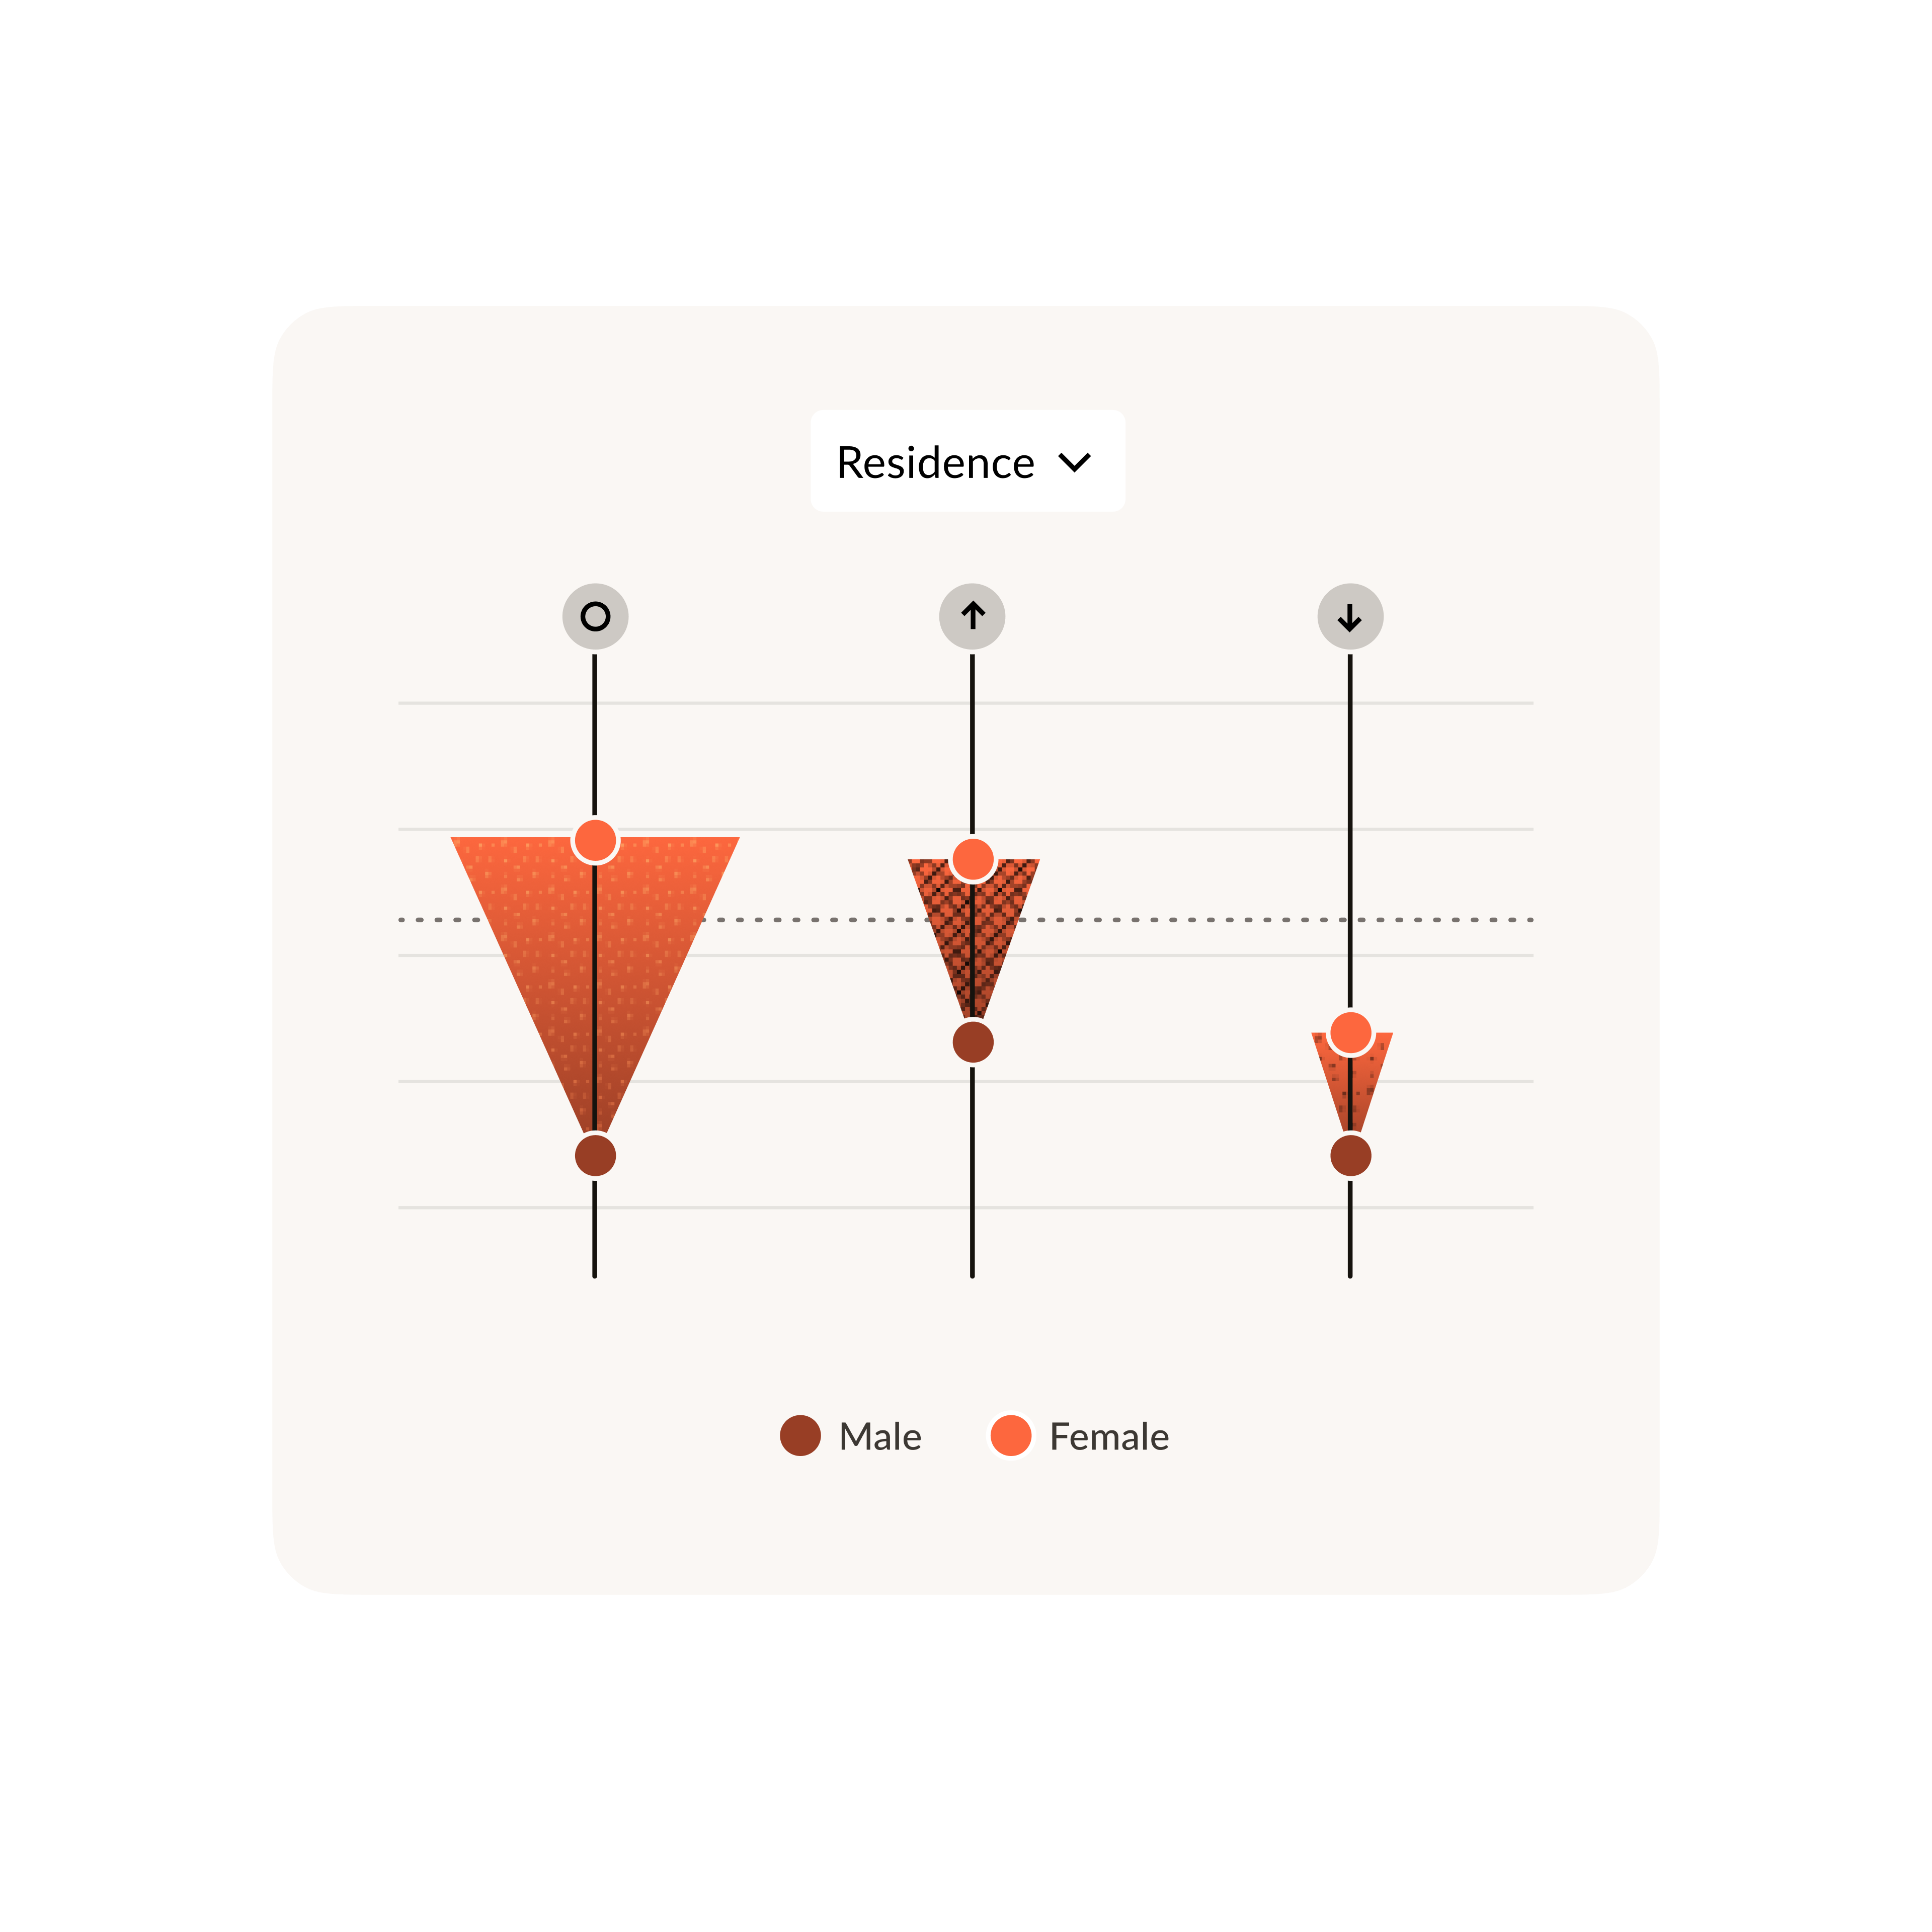
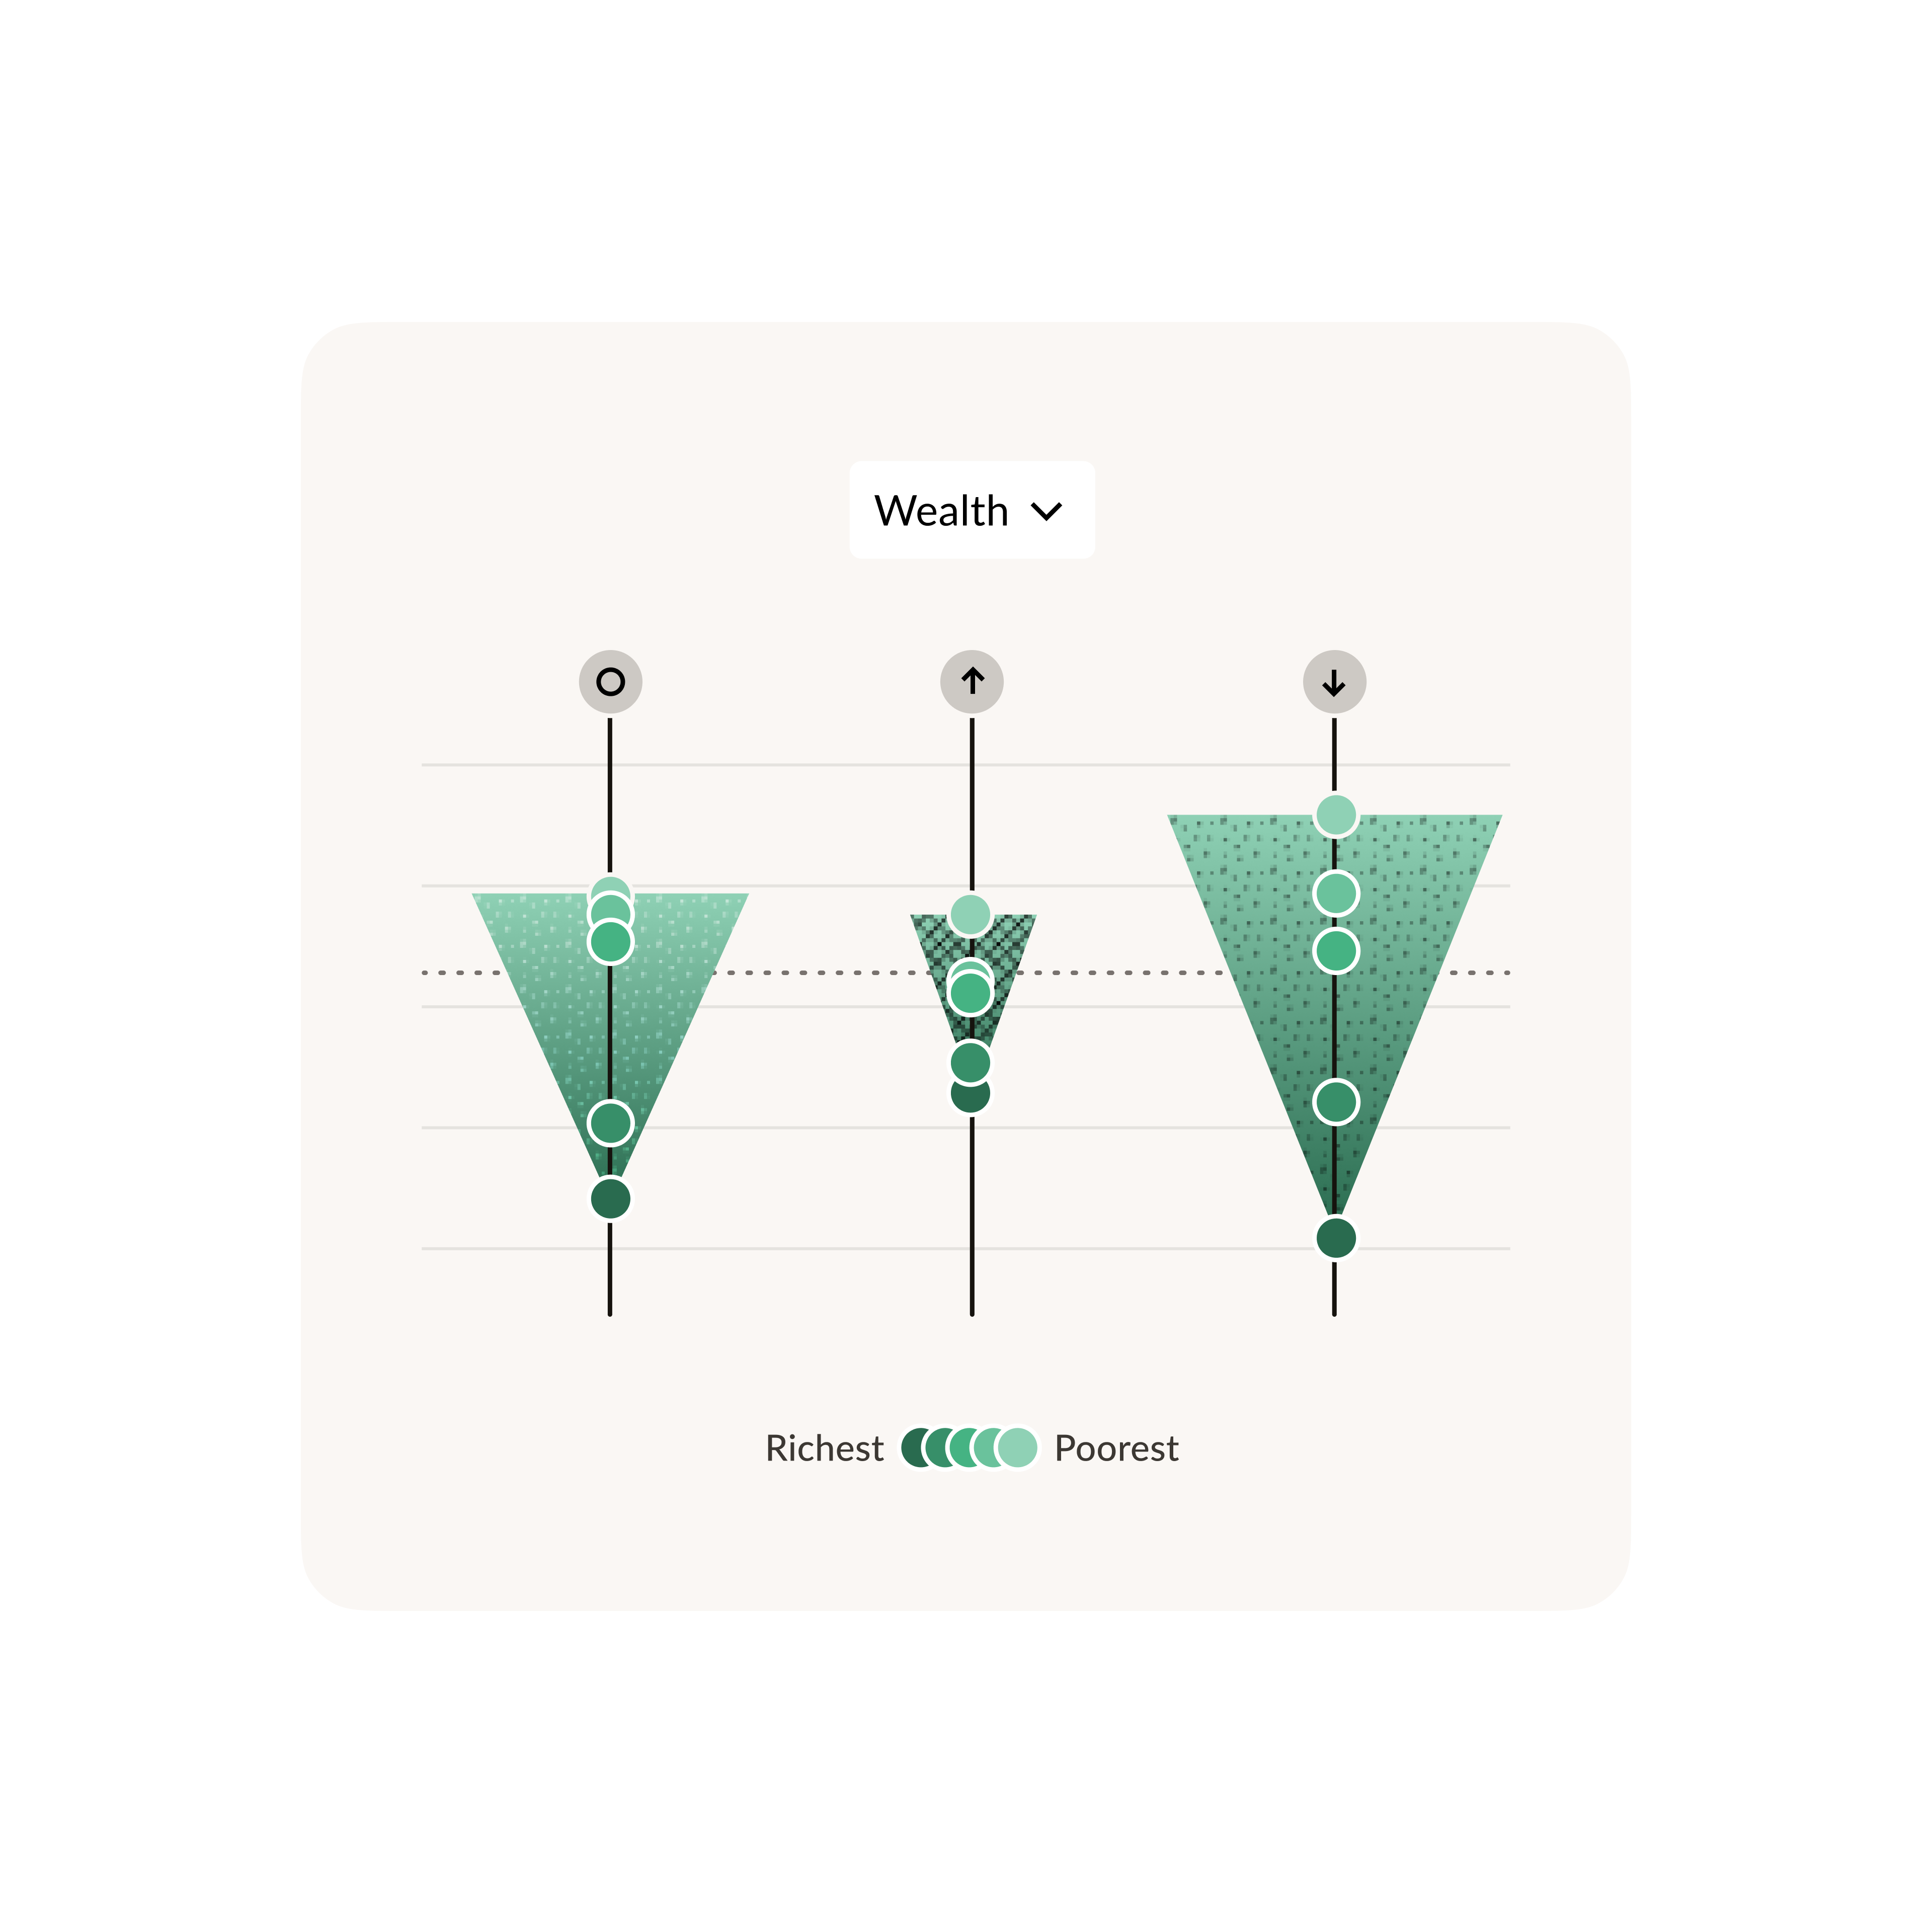
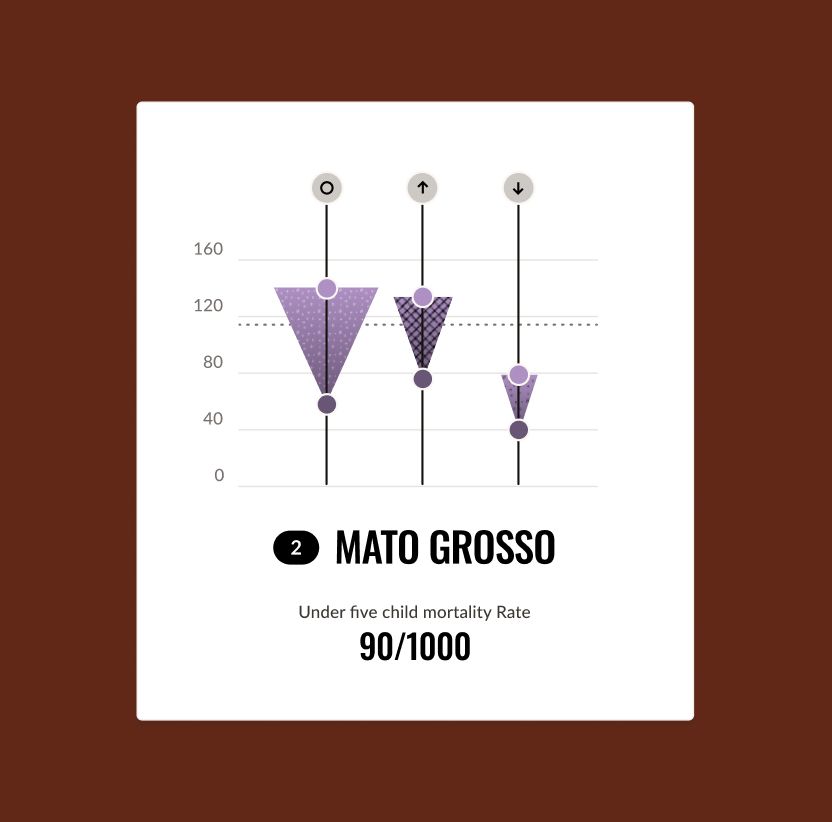
Triangles that measure inequality. To show inequality, the charts use triangles that grow wider as the data between groups moves further apart: the bigger the triangle, the bigger the inequality. This highlights the difference at a glance and gives the design a large surface to carry the hand-drawn texture.
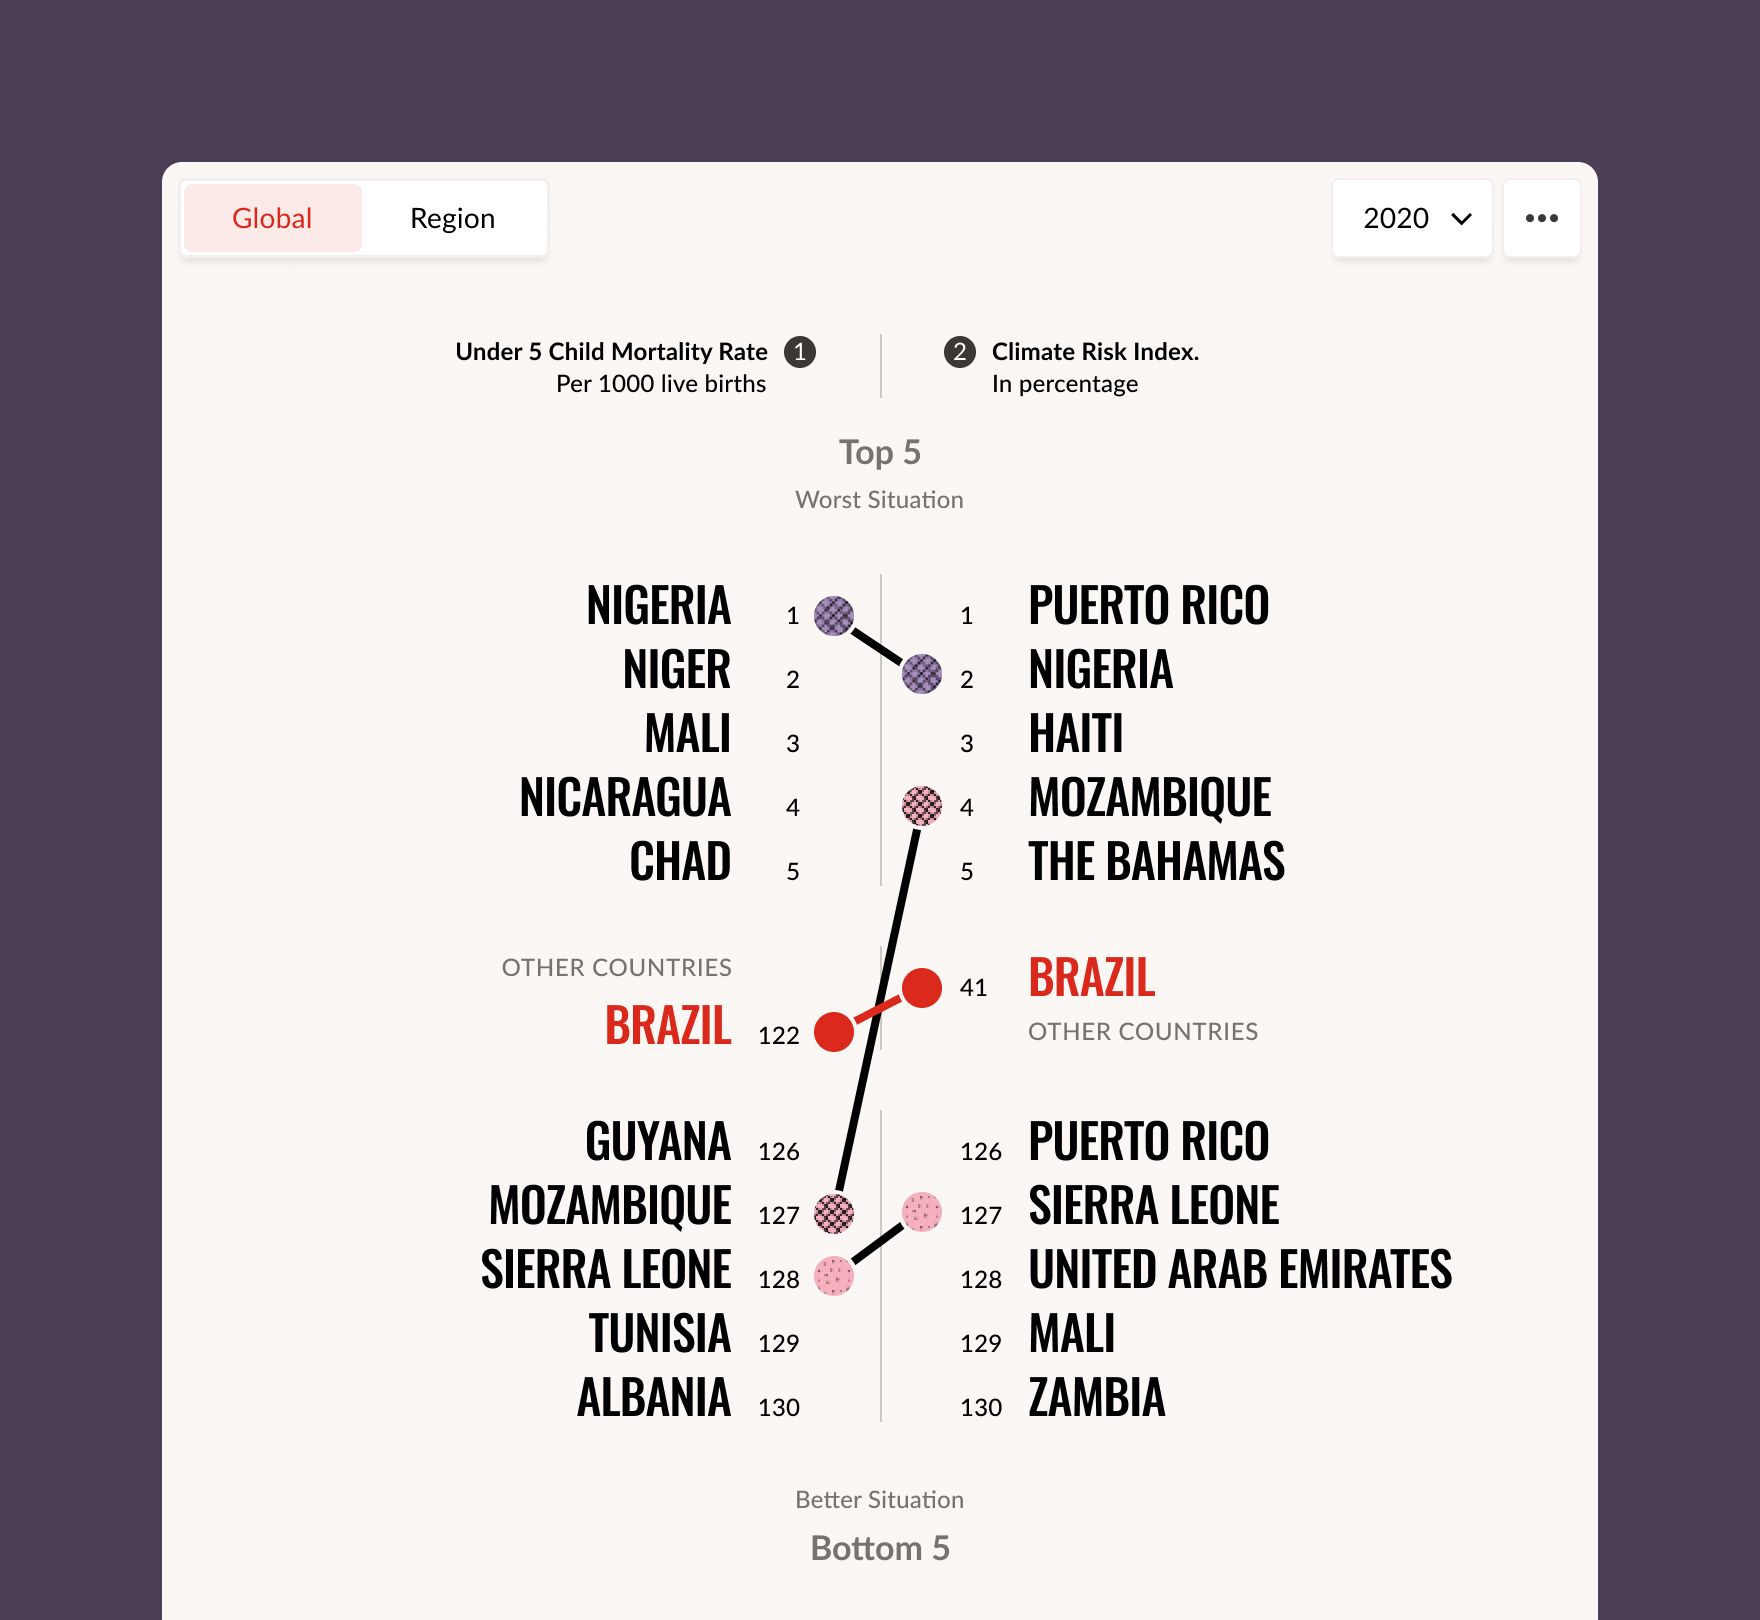
Rankings that compare two datasets. The ranking chart compares two datasets chosen by the user. Each side lists the five countries in the worst situation and the five in the best for one indicator, and the selected country stays highlighted on both. You can see at a glance whether its position is the same in both rankings or not. Lines connect the two lists, and their style shows whether the relationship is strong, inverse, weak, or missing data.
A comprehensive tool for analysis
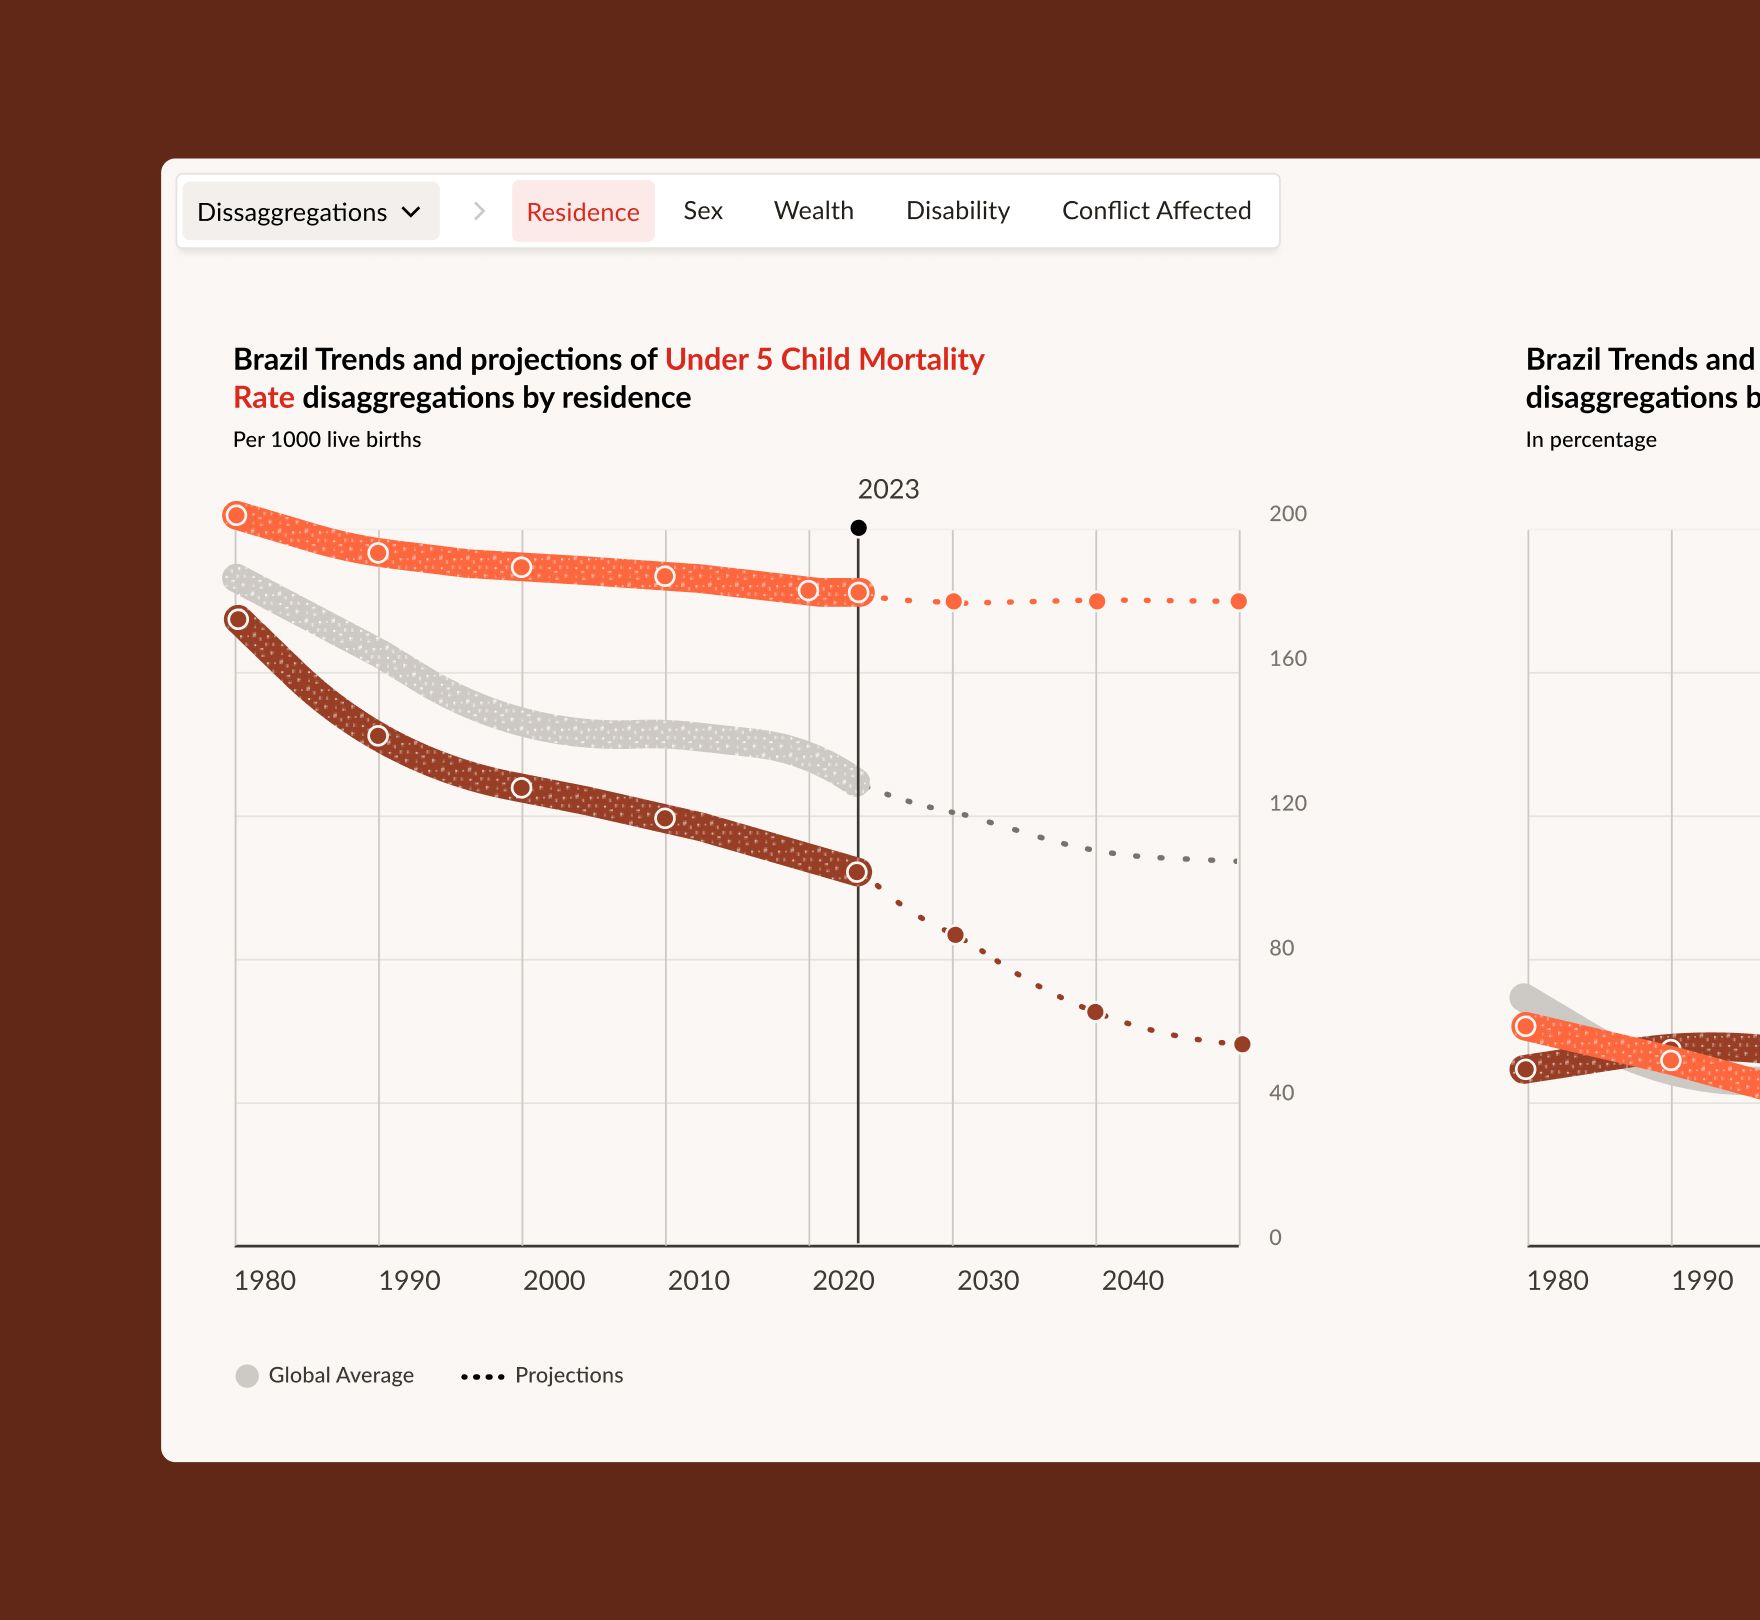
The design turns a large, uneven dataset into something people can analyze from many angles: comparing topics, looking across countries and over time, and moving from the global picture down to a single country or group of children. Throughout, children's own words sit next to the numbers, so the people behind the data stay in view.
Save the Children launched the Atlas at the UN in September 2023, using its data in the launch announcement, and presented it on the World Bank's Open Data blog. It has kept growing since launch, with a context layer that overlays risks such as conflict and climate, short explainers for each indicator, and SDG progress stats built into its tools.
Team
Sociopublico: Client side / management / Development.
Ezequiel Salatino: Art direction / Visual design / UI-UX / Data Visualizations. Lee Rembrandt: Help with Doodles and illustrations.